Descriptives
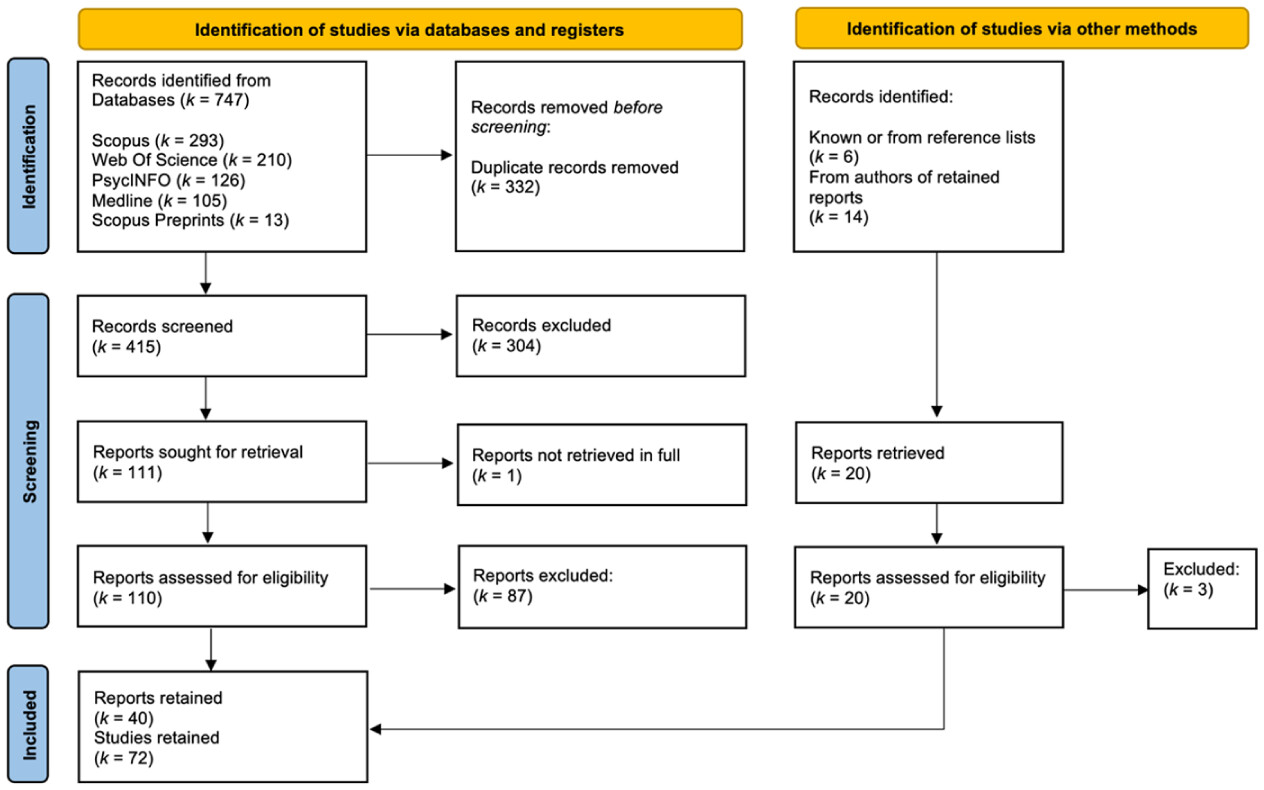
The 72 studies retained from 40 reports describe a steady upward trend in research interest over time since 2019 (see
Figure 4). Of the studies, 46 (64%) randomly allocated participants to conditions and thus constituted experiments. Of those, 39 (85% of experiments; 54% overall) were controlled trials. Most studies drew a convenience sample (
k = 58; 81%), the location of which was most often the US or indeterminate (
kUS = 27;
kIndeterminate Location = 27;
kGlobal South = 4). Most studies were conducted online (
k = 61; 85%;
kProlific = 29;
kGame Website = 15) and approximately half were pre-registered (
k = 35; 49%).
The full set of studies tested 23 distinct DTIIMs, of which 14 were games and nine were videos. There was an approximately even split between interventions that addressed misinformation broadly and those that focused on a topic (
k = 12). Of the topic-focused interventions, the majority were health-related (
k = 9), usually concerning vaccination or COVID-19 misinformation (
k = 7). Of the 72 studies, 59 (82%) tested a game-based DTIIM, 43 of which focused on a game described by designers as active inoculation. No studies described a video-based DTIIM as an active inoculation intervention. Approximately half of the tests of games and 40% of tests overall (
k = 29) were of
Bad News, a browser-based game that served as the template for other DTIIM games classified as active inoculation (e.g.,
Go Viral! and
Bad Vaxx). The other stand-out intervention to have undergone repeated testing was the emotional language video featured in
Roozenbeek, van der Linden, Goldberg, et al. (2022;
k = 12).
Theoretical: Inclusion of Relevant Factors
Research question A1 focuses on the extent to which key factors, mechanisms, and pathways of psychological inoculation were considered by the studies. We first examined the measurement of perceived threat to inform an assessment of the link between tests of DTIIMs and a key premise of psychological inoculation theory that threat conferral is requisite (A2). In total, five studies (7%) measured perceived threat (
Basol et al., 2021: Study 2;
Capewell et al., 2024: Study 2;
Maertens et al., 2025: Studies 2, 4, and 5). Some version of the “motivational threat” scale (
Banas & Richards, 2017) was employed by four studies (
Basol et al., 2021: Study 2;
Maertens et al., 2025: Studies 2, 4, and 5), 1 of which (
Basol et al., 2021: Study 2) also reported threat as measured by the “apprehensive threat” scale (
Burgoon et al., 1978). The fifth study took a broad composite of those and other scales to operationalize perceived threat (
Capewell et al., 2024: Study 2). Only the three studies from
Maertens et al. (2025) included hypotheses relating to threat, all of which pertained to longitudinal effects over time.
2 No studies included a hypothesis relating to threat perception during or immediately post-intervention.
We then considered the extent to which studies of DTIIM games classified by creators as active inoculation (e.g.,
Bad News and
Bad Vaxx but not
Fake News Detective or
Spot the Troll) measured post-intervention counterarguing. We did this to ascertain the link between tests of active DTIIMs and a premise of psychological inoculation theory that producing counterarguments (i.e., active inoculation) will stimulate post-intervention counterarguing in inoculated participants (A2). No test of a DTIIM game described as active inoculation considered post-intervention counterarguing, though one test of a video-based DTIIM included a single-item measure of this construct (
Hughes et al., 2024).
We also catalogued the inclusion of other theoretically relevant factors and mechanisms beyond those of the basic model. A total of nine studies assessed factors other than threat and counterarguing (
kMemory = 4;
kAnger = 3;
kSelf-Efficacy = 2;
kSource Credibility = 1;
kIssue Involvement = 1). Memory for refutations over time, as a longitudinal outcome, was the most common alternate factor (
Capewell et al., 2024: Study 2;
Maertens et al., 2025: Studies 2, 4, and 5).
Empirical: Measures, Test-Items, and Item-Scales
To address our research question concerning how susceptibility to misinformation has been assessed (B1), we determined how many studies included susceptibility to misinformation as a dependent variable and the ratings upon which the reported effects were based. Of the 72 studies, 67 (93%) operationalized susceptibility to misinformation via ratings of test-stimuli such as simulated social media posts or headlines. Of the stimuli rating studies, 31 involved ratings of perceived reliability, 14 of veracity (or accuracy or truth), 11 of manipulativeness, and eight of trustworthiness. Additionally, 11 studies assessed technique recognition with multi-choice questions, and 20 enquired into sharing intentions (or willingness or likelihood).
Research question B2 concerned how well susceptibility to misinformation was estimated by statistical analyses and operationalized by the scales of test-items employed in DTIIM research. To address this question in relation to the ability of tests to infer broad-spectrum protection against misinformation, we considered the inclusion of dependent variables discernment and response bias or skepticism. Of the 67 stimuli rating studies,
k = 39 (58%) reported analyses related to discernment and
k = 10 (15%) reported analyses related to response bias or skepticism. Of those studies, 13 calculated discernment and eight calculated response bias via a SDT approach, all of which used ROC curve analysis.
Figure 5 shows that the trend over time has been to consider these outcomes more, especially discernment.
Regarding the mitigation of potential confounds associated with item effects within DTIIM studies, we note two apparent approaches: item matching and treating items as a crossed random factor with participants in statistical analyses. Regarding item matching, 19 stimuli rating studies (28%) attempted some method of aligning misinformation and non-misinformation stimuli on extraneous characteristics such as word count and topic (
Appel et al., 2025: Studies 1–3;
Capewell et al., 2024: Studies 1 and 2;
Maertens et al., 2025: Studies 3–5; Penny
cook et al., 2024: Studies 1–5;
Roozenbeek, van der Linden, Goldberg, et al., 2022: Studies 1–6). Regarding the statistical approach, four of the stimuli rating studies (6%) included an analysis that treated items as a crossed random factor with participants in a mixed-effects model. This constituted the primary analysis in two studies (
Leder et al., 2024: Studies 1 and 2), while in two others it appeared as a robustness check (
Lees et al., 2023: Study 1;
Roozenbeek et al., 2020). We noticed a handful of other studies included such analyses in their Supplementary Materials but did not reference them in the main body of the study, so they were not coded as reported analyses (e.g.,
Appel et al., 2025: Studies 1–3).
To help address our research question regarding the potential implications of item effects in DTIIM research (B3), we sought to identify stimuli that may have been repeatedly used in testing. This assessment was made because item effects pertain to characteristics of specific items such that when items are often recycled, confounding effects may be replicated across tests (
DeBruine & Barr, 2021). To that end, we coded all 1,436 individual item-uses across the 67 stimuli rating studies. This revealed 21 specific items that stood out for having been repeatedly used to assess the effects of DTIIMs, and
Bad News in particular (
nRange Total = 10–25 uses per item;
nBad News = 10–19 uses per item;
kBad News = 29 tests in total). Of those items, three operationalized non-misinformation and 18 misinformation, with three misinformation items representing each of six rhetorical techniques featured in
Bad News (see the online Supplemental Spreadsheets for details).
To answer our research question concerning the quality of estimates of susceptibility to misinformation with regards to the characteristics of item-scales (B2), we considered: the inclusion of produced and sampled test-items; the ratios of misinforming and non-misinforming items in scales; the length of scales and subscales; and reports of scale validity and reliability. We identified a total of 89 item-scale-uses within the 67 stimuli rating studies. Regarding the inclusion of items that were either produced by researchers or selected from real-world examples,
n = 45 (51%) scales were comprised of solely produced stimuli,
n = 26 (29%) were comprised of solely selected stimuli,
n = 16 (18%) contained produced misinforming- and selected non-misinforming-stimuli, and
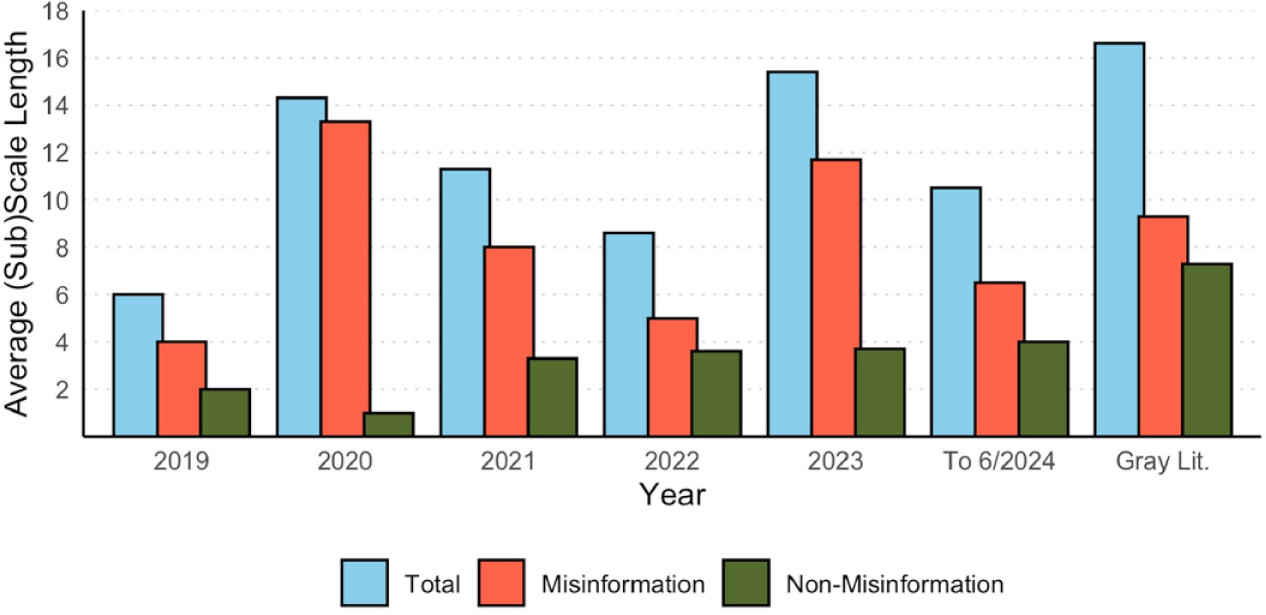
n = 2 (2%) did not report this information. Ratios of misinforming to non-misinforming items in scales ranged between 1:1 (50% misinformation) and 1:0 (100% misinformation). Across all scales appearing in stimuli rating studies, the ratio of misinformation to non-misinformation was 2.3:1 (70% misinformation), with an average total length of 11.84 items containing 8.27 misinformation and 3.57 non-misinformation items (see
Figure 6 for a graphical representation of scale and subscale length by year). Regarding the psychometric properties of item-scales, we found two studies (3%) used a scale that was validated by our pre-set criteria and 14 (21%) reported scale or subscale reliability (⍺ = .14 to .88). Of the 46 individual reports of reliability appearing in those studies,
n = 17 (37%) returned ⍺ < .60, 15 of which pertained to non-misinformation subscales.