a Mouse-click data
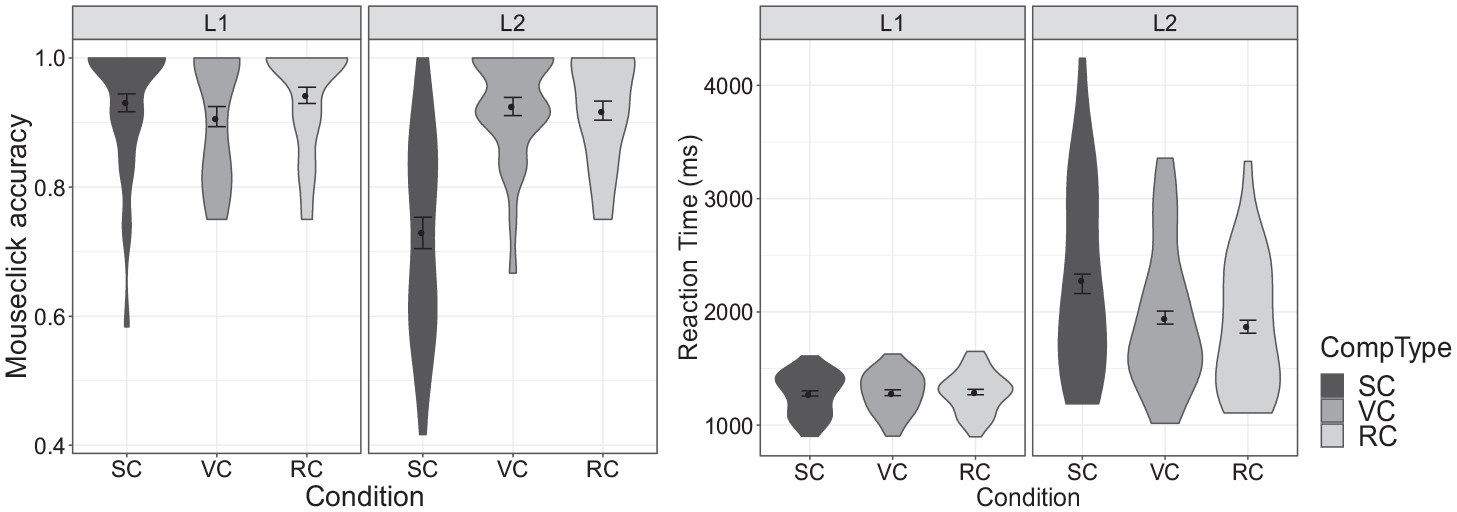
Participants’ accuracy in selecting the named target is illustrated in
Figure 2 (left). While the L1 group showed similar accuracy rates across conditions, accuracy in the L2 group was substantially lower in the SC condition than in the other two. For statistical analysis, accuracy data were submitted to a generalized linear mixed effect model. This and all subsequent statistical analyses were conducted in R (version, 3.6.0,
R Core Team, 2019), using the lme4 package (version 1.1-21,
Bates et al., 2015). Fixed effects included Group (L1, L2; contrast-coded and centered), Condition (SC, RC, VC; simple coded with VC as reference level) and their interactions. Maximal random effect structures justified by the design were attempted, and reduced if convergence problems arose (
Barr et al., 2013). Model comparisons were carried out using the
anova() function to identify the best-fitting model.
Table 1 presents the output of the best-fitting model. The significant negative estimate for group (
b = −0.72,
p = .01) indicates lower accuracy overall in the L2 than in the L1 group. The significant negative estimate for SC (
b = −1.33,
p = .03) indicates overall lower performance in the SC than in the (reference-level) VC condition. In other words, participants were less accurate in selecting the named target when there was a competitor that differed only in tone versus a competitor differing in both tone and segmental content. Importantly, this effect interacted with Group (
b = −2.04,
p < .001), prompting follow-up analyses within each group separately. Within the L1 group, there were no significant differences in accuracy across conditions (all
p > .4). In the L2 group, on the other hand, accuracy in the SC condition was significantly lower compared to the VC (
b = −2.24,
p < .001) and RC (
b = −3.10,
p = .002) conditions, with no significant differences between the latter two (
b = 0.86,
p = .49).
Analyses of reaction time (RT) in trials with correct mouse-clicks (
Figure 2 right) echoed the results from the analysis of accuracy. RTs in the L2 group (
ML2 = 2,036,
SDL2 = 716) were substantially longer overall than in the L1 group (
ML1 = 1,285,
SDL1 = 184), indicating generally greater difficulty in recognizing Mandarin words among L2 learners. Statistical analysis was conducted using mixed-effect models of the inverse-gaussian family due to the skewed distribution of the RT data (
Lo and Andrews, 2015). Otherwise the same modeling strategies were followed as in the analysis of accuracy. Results from the best-fitting model
RT ~ group * condition + (1 s| participant) + (1 + condition | item) confirmed that the L2 group took longer than the L1 group in making correct choices (
b = 700.69,
p < .001), and that participants took longer in the SC than in the VC condition (
b = 111.47,
p = .02). The interaction between Group and Condition (SC vs. VC) was significant (
b = 181.19,
p < .001), prompting follow-up analyses within each group. In the L1 group, there were no differences in RT by condition (SC vs. VC:
b = 20.78,
p = .29; RC vs. VC:
b = 2.44,
p = .90; SC vs. RC:
b = −18. 35,
p = .37). The L2 group, by contrast, took substantially longer to make correct choices in the SC condition compared to the VC (
b = 194.13,
p < .001) and the RC (
b = 216.17,
p < .001) condition, with no difference between the latter two (
b = −21.93,
p = .46).
In sum, the L2 group achieved accuracy comparable to the L1 group in the RC and VC conditions, and within the L2 group, learners were equally fast on correct target selections in these two conditions. In the SC condition, on the other hand, where tone was the only cue distinguishing the target from the competitor, L2 participants were significantly less accurate than L1 participants, and took longer on correct selections than in the other two conditions. L2 participants also showed substantially more variability on both accuracy and RT in the SC condition than L1 participants (
Figure 2). It is possible that this variability stems from the inclusion of L2 participants who were unable to distinguish words by tone alone, and were thus simply guessing in the SC condition. In order to identify such participants, we examined the probability of a participant guessing in the SC condition based on a binomial distribution. Assuming that the critical choice was between the target and the competitor (even though there was a third, phonologically unrelated distractor in the scene), chance was assumed to be at .5. Adopting an alpha level of .05, the binomial distribution indicates that correct responses on at least 9 out of 12 items represents performance significantly above chance. All participants in the L1 group met this criterion, as did 15 out of the 29 L2 learners. We will refer to this subgroup as the ‘L2-above-chance learners’. The remaining 14 L2 participants were at chance (‘L2-at-chance learners’). Proficiency measured on the listening task was higher in the L2-above-chance (
M = 0.86,
SD = 0.13) than the L2-at-chance (
M = 0.67,
SD = 0.17) subgroup (
b = −0.19,
p = .002).
In order to examine whether L1–L2 differences in the SC condition persist when comparing only L2 learners with statistically significant sensitivity to tones (the above-chance-subgroup) with L1 speakers, we reran the analysis of accuracy reported above with Group treated as a 3-level rather than a 2-level factor (L1, L2-above-chance, L2-at-chance; simple coded with L1 as reference level). Results showed no significant difference in overall accuracy between the L2-above-chance and the L1 group (b = −0.005, p = .99), while the L2-below-chance group performed significantly below both (bs > |1.20|, ps < .001). Interactions between Group and Condition (SC–VC) remained significant for both the L2-at-chance vs. L1 (b = −2.17, p < .001) and the L2-above-chance vs. L1 (b = −1.80, p = .001) comparisons, but were non-significant for the L2-at-chance vs. L2-above-chance comparison (b = −.37, p = .5). Within-group analyses showed no significant differences between the RC and VC conditions in either L2 subgroup. In the L2-at-chance group, accuracy in SC was significantly worse than in the VC condition (b = −2.06, p < .001); in the L2-above-chance group, this difference was only marginally significant (b = −1.58, p = .053).
We thus find the pattern of results from the initial comparison between the L1 and L2 groups repeated in the comparison between the L1 and the L2-at-chance subgroup. This is unsurprising given that this L2 subgroup was defined by chance performance when the recognition of the target critically required reliance on tone. More importantly, we also find the pattern largely repeated, though somewhat weaker, in the comparison between the L1 and the L2-above-chance group. Notably, the interaction between group and the SC–VC comparison remained significant, and follow-up analysis within the L2-above-chance group still showed a marginal trend towards lower accuracy in the SC than the VC condition. Analogous analyses of RT on correct responses further showed that, unlike in the L1 group (see above), RTs in the SC vs. the VC condition were longer in both the L2-at-chance (b = 258.35, p = .002) as well as the L2-above-chance (b = 179.05, p < .001) subgroups. These findings suggest that even for L2 learners with demonstrated above-chance ability to recognize target nouns by tone alone, performance does not fully mirror that of L1 speakers.
b Eye-movement data
In order to further explore these differences between the L2-above-chance and the L1 groups, we investigated the time course of participants’ looks to targets and competitors in the visual scene as they were listening to the noun in real time.
Figure 3 illustrates L1 and L2-above-chance participants’ looking patterns in the SC, VC and RC conditions on trials in which they selected the correct target. Visual inspection of fixation patterns in the L1 group shows little evidence of competition in any condition, with looks to competitors decreasing sharply, along with looks to phonologically unrelated distractors, about 200 ms after the onset of the noun. In the L2-above-chance group, looks to the target in the VC and RC conditions increase on a similar timescale as in the L1 group, but asymptote at a lower level. At the same time, looks to competitors remain more persistent, a pattern that appears particularly evident in the SC condition.
Statistical analysis was conducted to address our research question on L1 and L2 listeners’ relative weighting of tonal and segmental cues. Specifically, our goal was to assess whether competition from a competitor differing only in tone would be stronger than from a competitor differing in both tone and segmental content, and whether this effect would be more pronounced in the L2 than in the L1 group. To this end, we compared the proportion of looks to the competitor (versus the target) in the SC versus the VC and RC conditions in both groups. The large difference in RT between the two groups (see above), however, raised the difficult question of the appropriate time period within which to analyse these looking patterns. We decided to honor the variability in the timing of participants’ decisions, as captured already by RT, and focus on a participant-driven time window, extending from 200 ms after noun onset (taking into consideration the time needed to execute a ballistic eye movement;
Matin et al., 1993) until mouse-click, i.e. until the participant selected the (correct) target in a given trial. Within this period, which varied by trial, we calculated the proportion of frames with fixations to the competitor out of fixations to target and competitor combined. This measure captures the proportion of time the participant spent looking at the competitor before making a final decision.
A linear mixed-effect model with Group (L1, L2-above-chance; contrast-coded and centered) and Condition (simple-coded, VC as reference) as fixed effects was fitted to these data. Given the highly non-normal distribution of the outcome measure at the trial level, models at the trial level including both random effects for participants and items proved to be a poor fit. We therefore decided to aggregate data over participants and over items, and fit two separate models to each (
Barr, 2008).
Table 2 presents the output from the best-fitting models, which showed similar patterns in the by-participant and by-item aggregations. The main effect of Group was significant (
b1 = 0.09,
p1 < .001;
b2 = 0.11,
p2 < .001), indicating that the L2 learners were overall more likely than native speakers to look at competitors. An overall trend for more looks to competitors in the SC (vs. VC) condition also emerged (
b1 = 0.04,
p1 = .02;
b2 = 0.03,
p2 = .10). This trend did not interact with Group, yet in light of our research question, we decided to explore its nature further through models fit to the data from each group separately. In the L1 group, no differences between SC vs. VC condition (
b1 = −0.02,
p1 = .16;
b2 = −0.03,
p2 = .35) or RC vs. VC condition (
b1 = 0.02,
p1 = .21;
b2 = 0.02,
p2 = .48) emerged. Within the L2 above-chance group, a significant difference was found between the SC and VC condition in the by-participant (
b1 = 0.06,
p1 = .04) but not in the by-item data (
b2 = 0.05,
p2 = .18); no significant differences were observed between the RC and VC conditions (
b1 = 0.005,
p1 = .86;
b2 = 0.007,
p2 = .83). In sum, even in trials with correct mouse-click, L2 listeners with the ability to discriminate words by tone showed more consideration of competitors overall, and tended to look at competitors more when tone was the only differing cue between targets and competitors than when they differed in both tone and segmental content; native speakers, by contrast, did not show any differences between conditions.