Introduction
Breast cancer (BRCA) is a molecularly heterogeneous tumor that currently accounts for approximately 32% of all newly diagnosed malignancies among females, surpassing lung cancer as the most prevalent cancer in women worldwide.
1,2 Emerging studies indicate that post-transcriptional dysregulation constitutes a major source of its genetic complexity.
3,4 Among these regulators, RNA-binding proteins (RBPs) orchestrate RNA splicing, stability, localization, and translation, thereby rewiring oncogenic programs across BRCA subtypes. Increasing evidence shows that RBPs dysregulation is pervasive in BRCA and tracks hallmarks such as proliferation, EMT, stemness, and therapy resistance, highlighting RBPs as actionable biomarkers and targets.
5RBPs are highly conserved important regulatory proteins required for maintaining the life cycle.
6 In total, 1542 RBPs have been discovered, of which around 60% of RBPs are expressed in a tissue-specific manner. RBPs bind to various RNA types (rRNA, ncRNA, snRNA, miRNA, mRNA, tRNA, and snoRNA) to form nuclear RNA complexes. These complexes perform several roles like stabilization, transportation, translation, splicing, and degradation of RNA. In addition, they are key post-transcriptional regulators of gene expression in cells.
7,8 RBPs participate in almost all PTGR processes to determine the fate and functions of each transcript in cells.
9,10 Aberrations in RBPs could alter RNA metabolism, transcriptome, and proteome of cells, which in turn, affects the growth, proliferative, and invasive capacities of cells.
8 Mounting evidence has shown the significant involvement of RBPs in cancer progression and patient prognosis.
10 Post-translational modifications and disorders of RBPs can not only increase oncogene expression but also promote tumorigenesis via the mechanism of decreasing the expression of tumor suppressor genes. HuR is an RBP that promotes tumorigenesis, which alters the stability of mRNAs and enhances cell proliferation and metastasis in gastric cancer.
11 A study has shown that MEX3A, a RBP, can independently determine the clinical course of BRCA, and the prognosis of patients expressing high levels of MEX3A is poor.
12 ZMAT3, another RBP, inhibits the expression of tumor suppressor genes like
p53 by directly modulating exon inclusion in transcripts encoding
p53 inhibitor proteins like MDM4 and MDM2.
13 These studies have enhanced our understanding of RBPs; however, only a few studies have determined the significance of RBPs in predicting the prognosis of patients with BRCA. With the growing understanding of molecular oncology, therapy selection in BRCA increasingly relies on predictive biomarkers.
14,15 Beyond the classical evaluation of ER/PR and HER2, emerging immune-related biomarkers have expanded the use of immune checkpoint inhibitors (ICIs) in early triple-negative breast cancer (TNBC). Landmark neoadjuvant trials—KEYNOTE-522, IMpassion031, and GeparNUEVO—have confirmed the clinical benefit of adding ICIs to chemotherapy and emphasized the ongoing refinement of PD-L1 status, TMB, and tumor-infiltrating lymphocytes (TILs) as predictors of therapeutic response.
16 Safety and adherence concerns of neoadjuvant chemo-immunotherapy have been systematically evaluated, revealing higher rates of grade 3–4 adverse events compared with chemotherapy alone, thereby underscoring the importance of toxicity monitoring in biomarker-defined patients.
17 In later-line settings, antibody–drug conjugates (ADCs) have reshaped the treatment landscape; notably, sacituzumab govitecan, a TROP2-directed ADC, has demonstrated real-world efficacy consistent with pivotal trials, highlighting the value of target expression and resistance mechanisms in guiding therapeutic choice.
18 Moreover, systemic host factors such as chronic inflammation, metabolic syndrome, and cancer cachexia burden (e.g. Cachexia Index (CXI)) are increasingly recognized as contextual determinants of treatment tolerance and outcomes, supporting a holistic, biomarker-integrated approach to BRCA management.
19,20Therefore, in this study, we comprehensively analyzed RBPs using RNAsequencing (RNAseq) and clinical data of patients with BRCA from the Cancer Genome Atlas (TCGA;
https://portal.gdc.cancer.gov/) database. We performed differential expression and survival analyses to screen RBPs to construct an RBP-based scoring model. Furthermore, we developed a clinical prognostic nomogram based on the RBP-based scoring model and clinical characteristics for predicting the patient’s survival outcomes. We determined the significance of the clinical prognostic nomogram for predicting the prognosis of patients with BRCA. Meanwhile, we also explored the expression and function of screened RBP, RPL9, in BRCA, hoping to identify novel diagnostic biomarker and therapeutic target for patients with BRCA. Finally, we analyzed the correlations between the scoring model and the tumor immune microenvironment (TIME) of patients with BRCA.
Materials and methods
Data acquisition
RNA-seq, somatic mutation, and clinical characteristics of 1085 female BRCA patients and 113 matched para-cancer samples were obtained from The Cancer Genome Atlas (TCGA) database. The TCGA-BRCA cohort encompasses a broad and representative spectrum of molecular subtypes (Luminal A, Luminal B, HER2-enriched, and Basal-like/triple-negative) and clinical stages (I–IV), thereby reflecting the realworld heterogeneity and epidemiological distribution of breast cancer. The majority of cases belonged to Luminal A and Luminal B subtypes, consistent with their natural prevalence, while other subtypes and advanced-stage samples were also adequately represented. To ensure data quality and consistency, only female patients diagnosed with primary BRCA who had complete RNA-seq profiles and comprehensive clinical information (including age, TNM stage, and overall survival time and status) were included. Samples lacking survival data, incomplete clinicopathological information, or low sequencing quality were excluded. Metastatic tumor samples, and duplicates were also removed. After stringent quality control, 1084 BRCA tumor samples and 113 matched adjacent normal tissues were retained for analysis. Moreover, all expression profiles were normalized to transcripts per million (TPM) and adjusted for batch effects using the “ComBat” function in the sva R package. To construct a robust prognostic model, (Least Absolute Shrinkage and Selection Operator) (LASSO) regression analysis with 10-fold cross-validation was applied to the TCGA-BRCA training cohort. The LASSO method was chosen because it simultaneously performs variable selection and regularization, effectively reducing the dimensionality of high-throughput RNA-seq data while preventing overfitting. In contrast to ridge regression, which only shrinks coefficient magnitude, or elastic net, which balances L1 and L2 penalties, LASSO generates sparse solutions by setting uninformative gene coefficients to zero, thus producing a concise and biologically interpretable gene signature. The 10-fold cross-validation (CV) strategy was selected because it achieves an optimal balance between bias and variance and has been extensively validated in highdimensional transcriptomic modeling. This approach enables each sample to serve as both training and testing data across iterations, ensuring model stability, robustness, and generalizability while maintaining computational efficiency. Therefore, the use of both LASSO regression and 10-fold CV was methodologically justified rather than arbitrary, providing a statistically sound foundation for constructing the RBP-based prognostic scoring model. The GSE1456 dataset obtained from the Gene Expression Omnibus Database (GEO,
https://www.ncbi.nlm.nih.gov/geo/) was used for validation, which contained data on clinical characteristics and gene expression of 159 patients with BRCA.
21,22 The RBPs were selected based on a previous study.
7Screening of RBPs
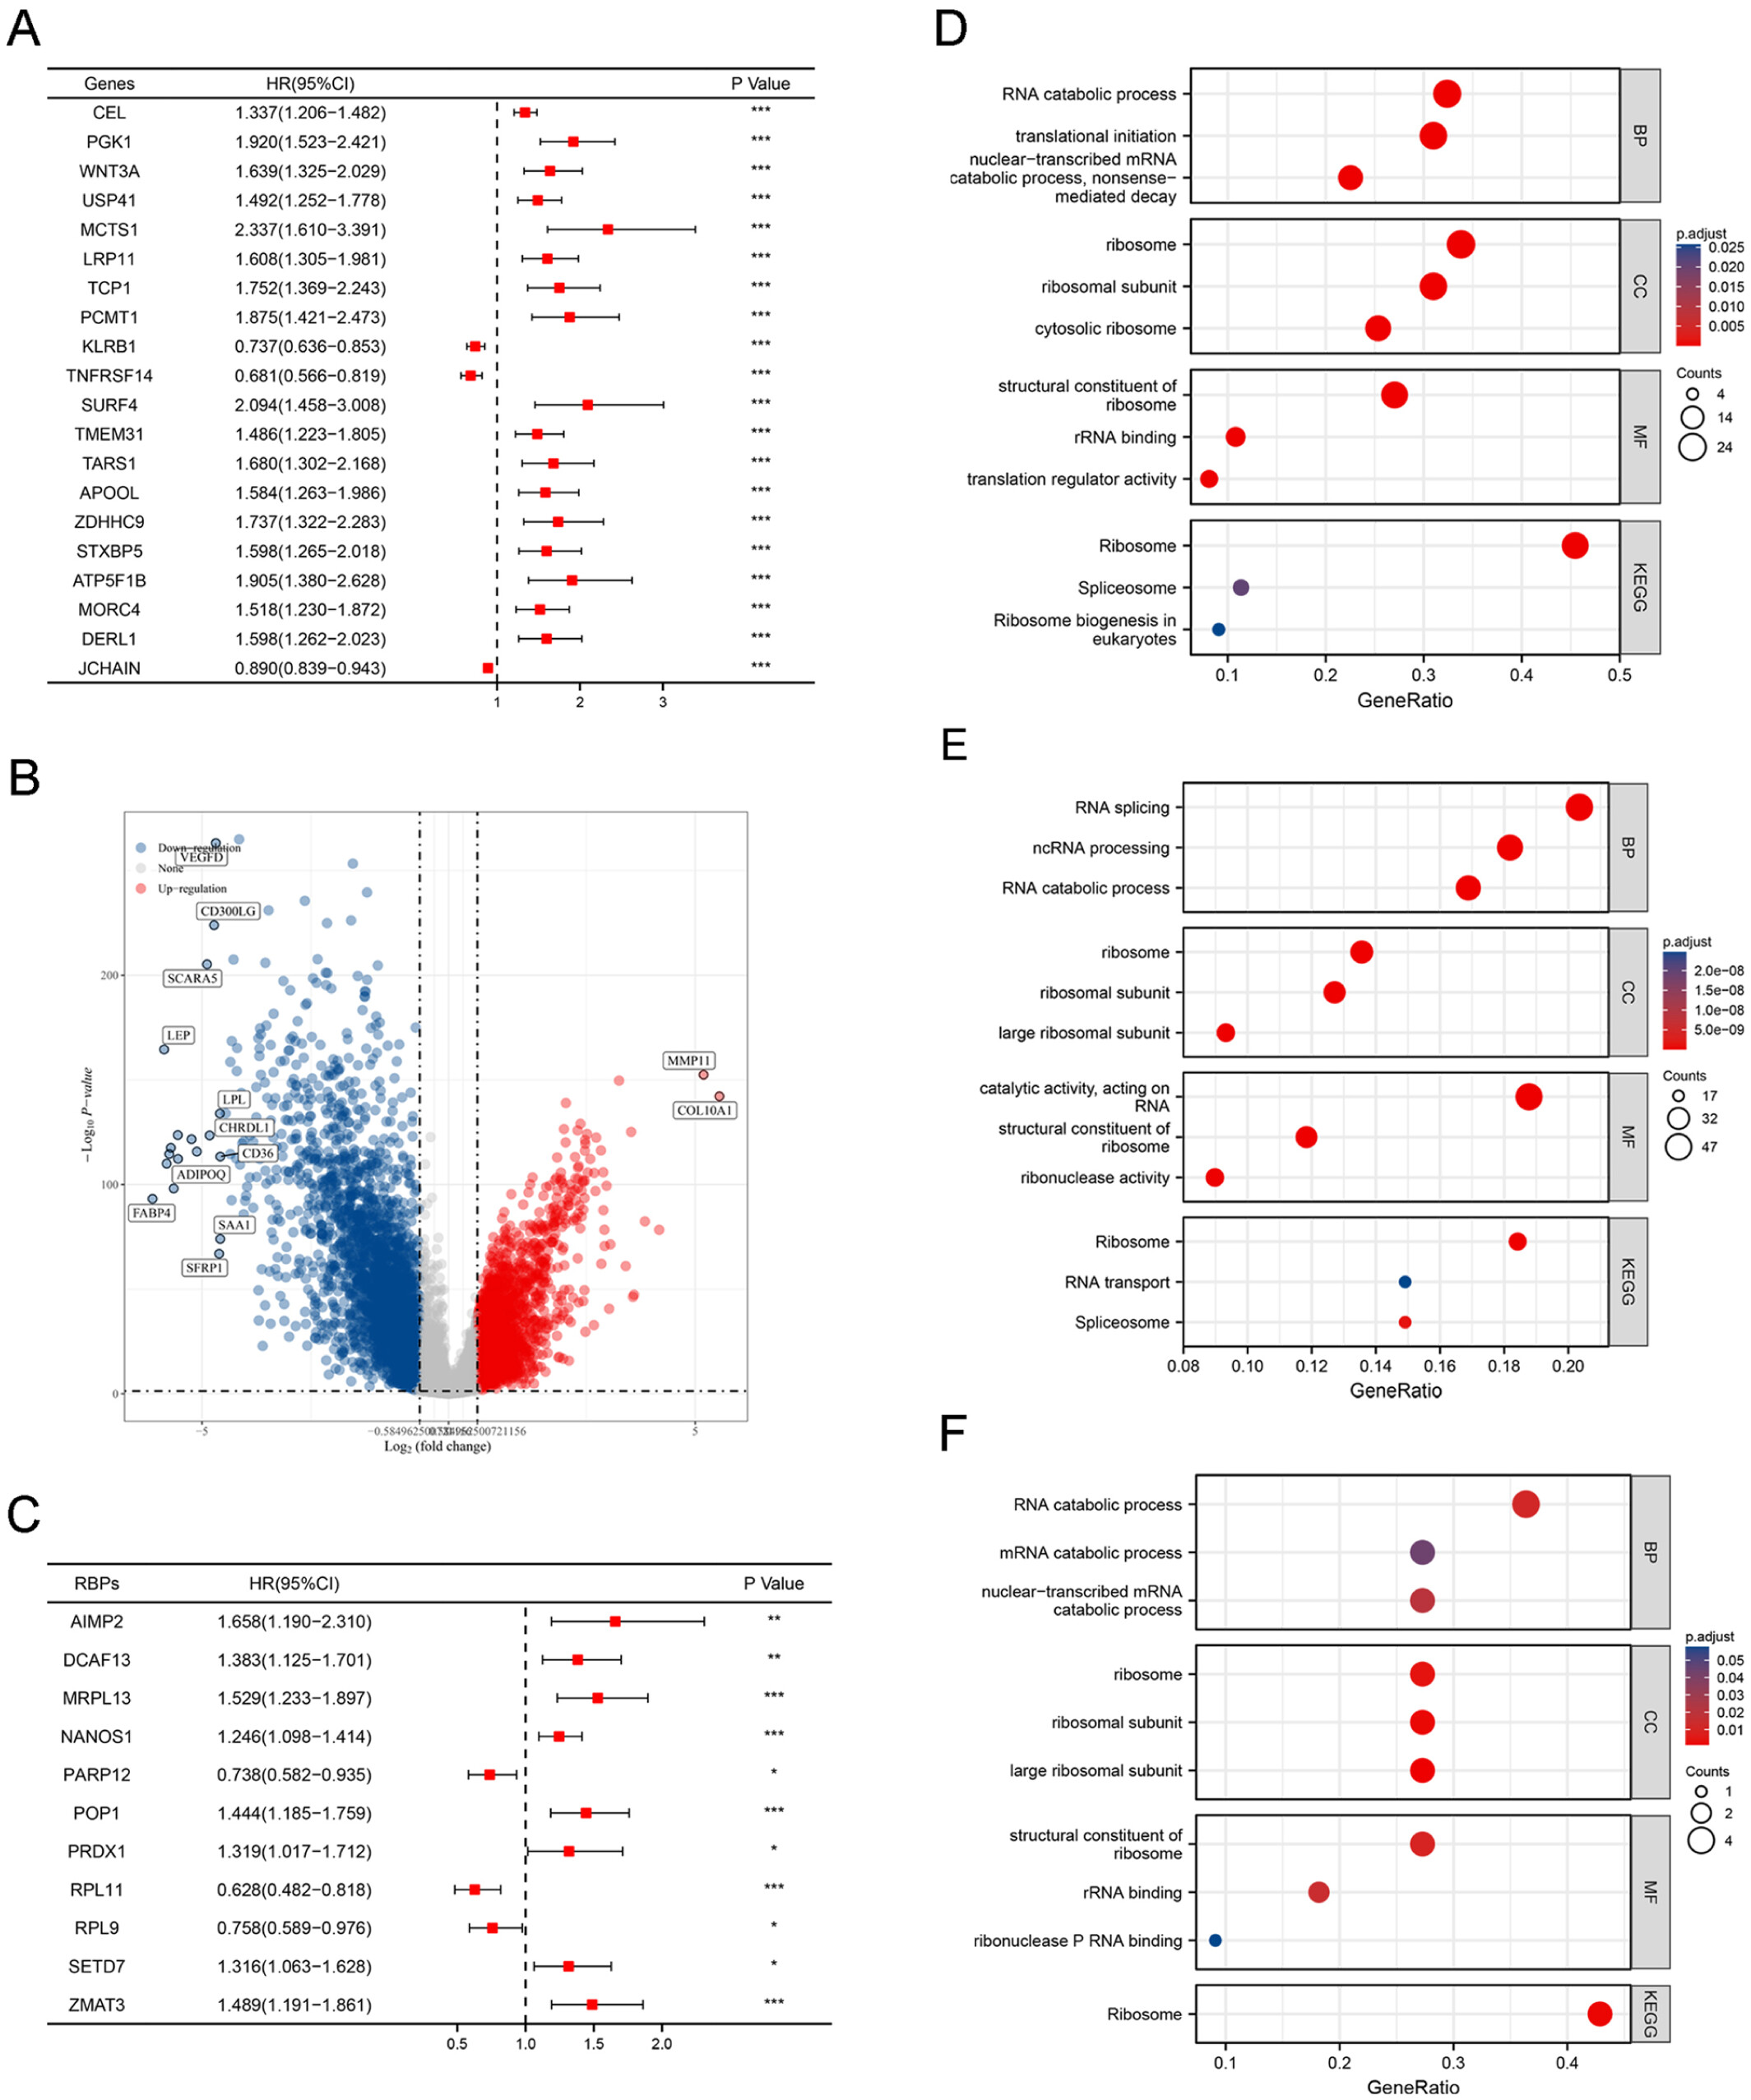
The log-rank test and univariate Cox regression analyses were conducted to calculate hazard ratios (HRs), 95% confidence intervals (CIs), and
P-values of all genes, as well as identify prognosis-related genes (with
P < 0.05) based on the RNA-seq and clinical data of patients in TCGA-BRCA cohort. The “survival” R package (
https://CRAN.R-project.org/package=survival) and the “survminer” package (
https://CRAN.R-project.org/package=survminer) was used to perform the analysis. We used the limma R package (version 3.40.2) to compare the RNA-seq data of 113 para-cancer and 1084 BRCA samples. Moderated
t-tests were applied, and all
P-values were adjusted for multiple testing using the Benjamini–Hochberg (BH) method to control the false discovery rate. RBPs with an adjusted
P-value (FDR) < 0.05 and |log₂ fold change (log₂FC)| > 1.5 were considered significantly differentially expressed. This approach ensures robust detection of genuine differential expression while minimizing false positives in large-scale transcriptomic comparisons.
23 Positive and negative values of log
2(FC) indicate upregulated and downregulated genes, respectively. The prognosis-related differentially expressed RBPs were identified by screening prognosis-related genes, differentially expressed genes (DEGs), and 1542 RBPs.
Gene ontology (GO) and Kyoto encyclopedia of genes and genomes (KEGG) pathway enrichment analysis
We performed GO enrichment analysis (
www.geneontology.org) to fully annotate RBPs functions like molecular functions (MF), biological pathways (BP), and cellular components (CC). KEGG pathway enrichment analysis (
www.genome.jp/keg) was used to identify biological pathways enriched by RBPs. GO and KEGG enrichment analyses were performed using the “clusterProfiler” R package,
24,25 and the threshold set for identifying significance enrichment was “adjusted
P < 0.05.” The “ggplot2 (
https://CRAN.R-project.org/package=survival)” and the “GOplot (
https://CRAN.Rproject.org/package=GOplot)” packages were used to plot maps for representing the results of enrichment analysis.
Establishment of the RBP-based scoring model
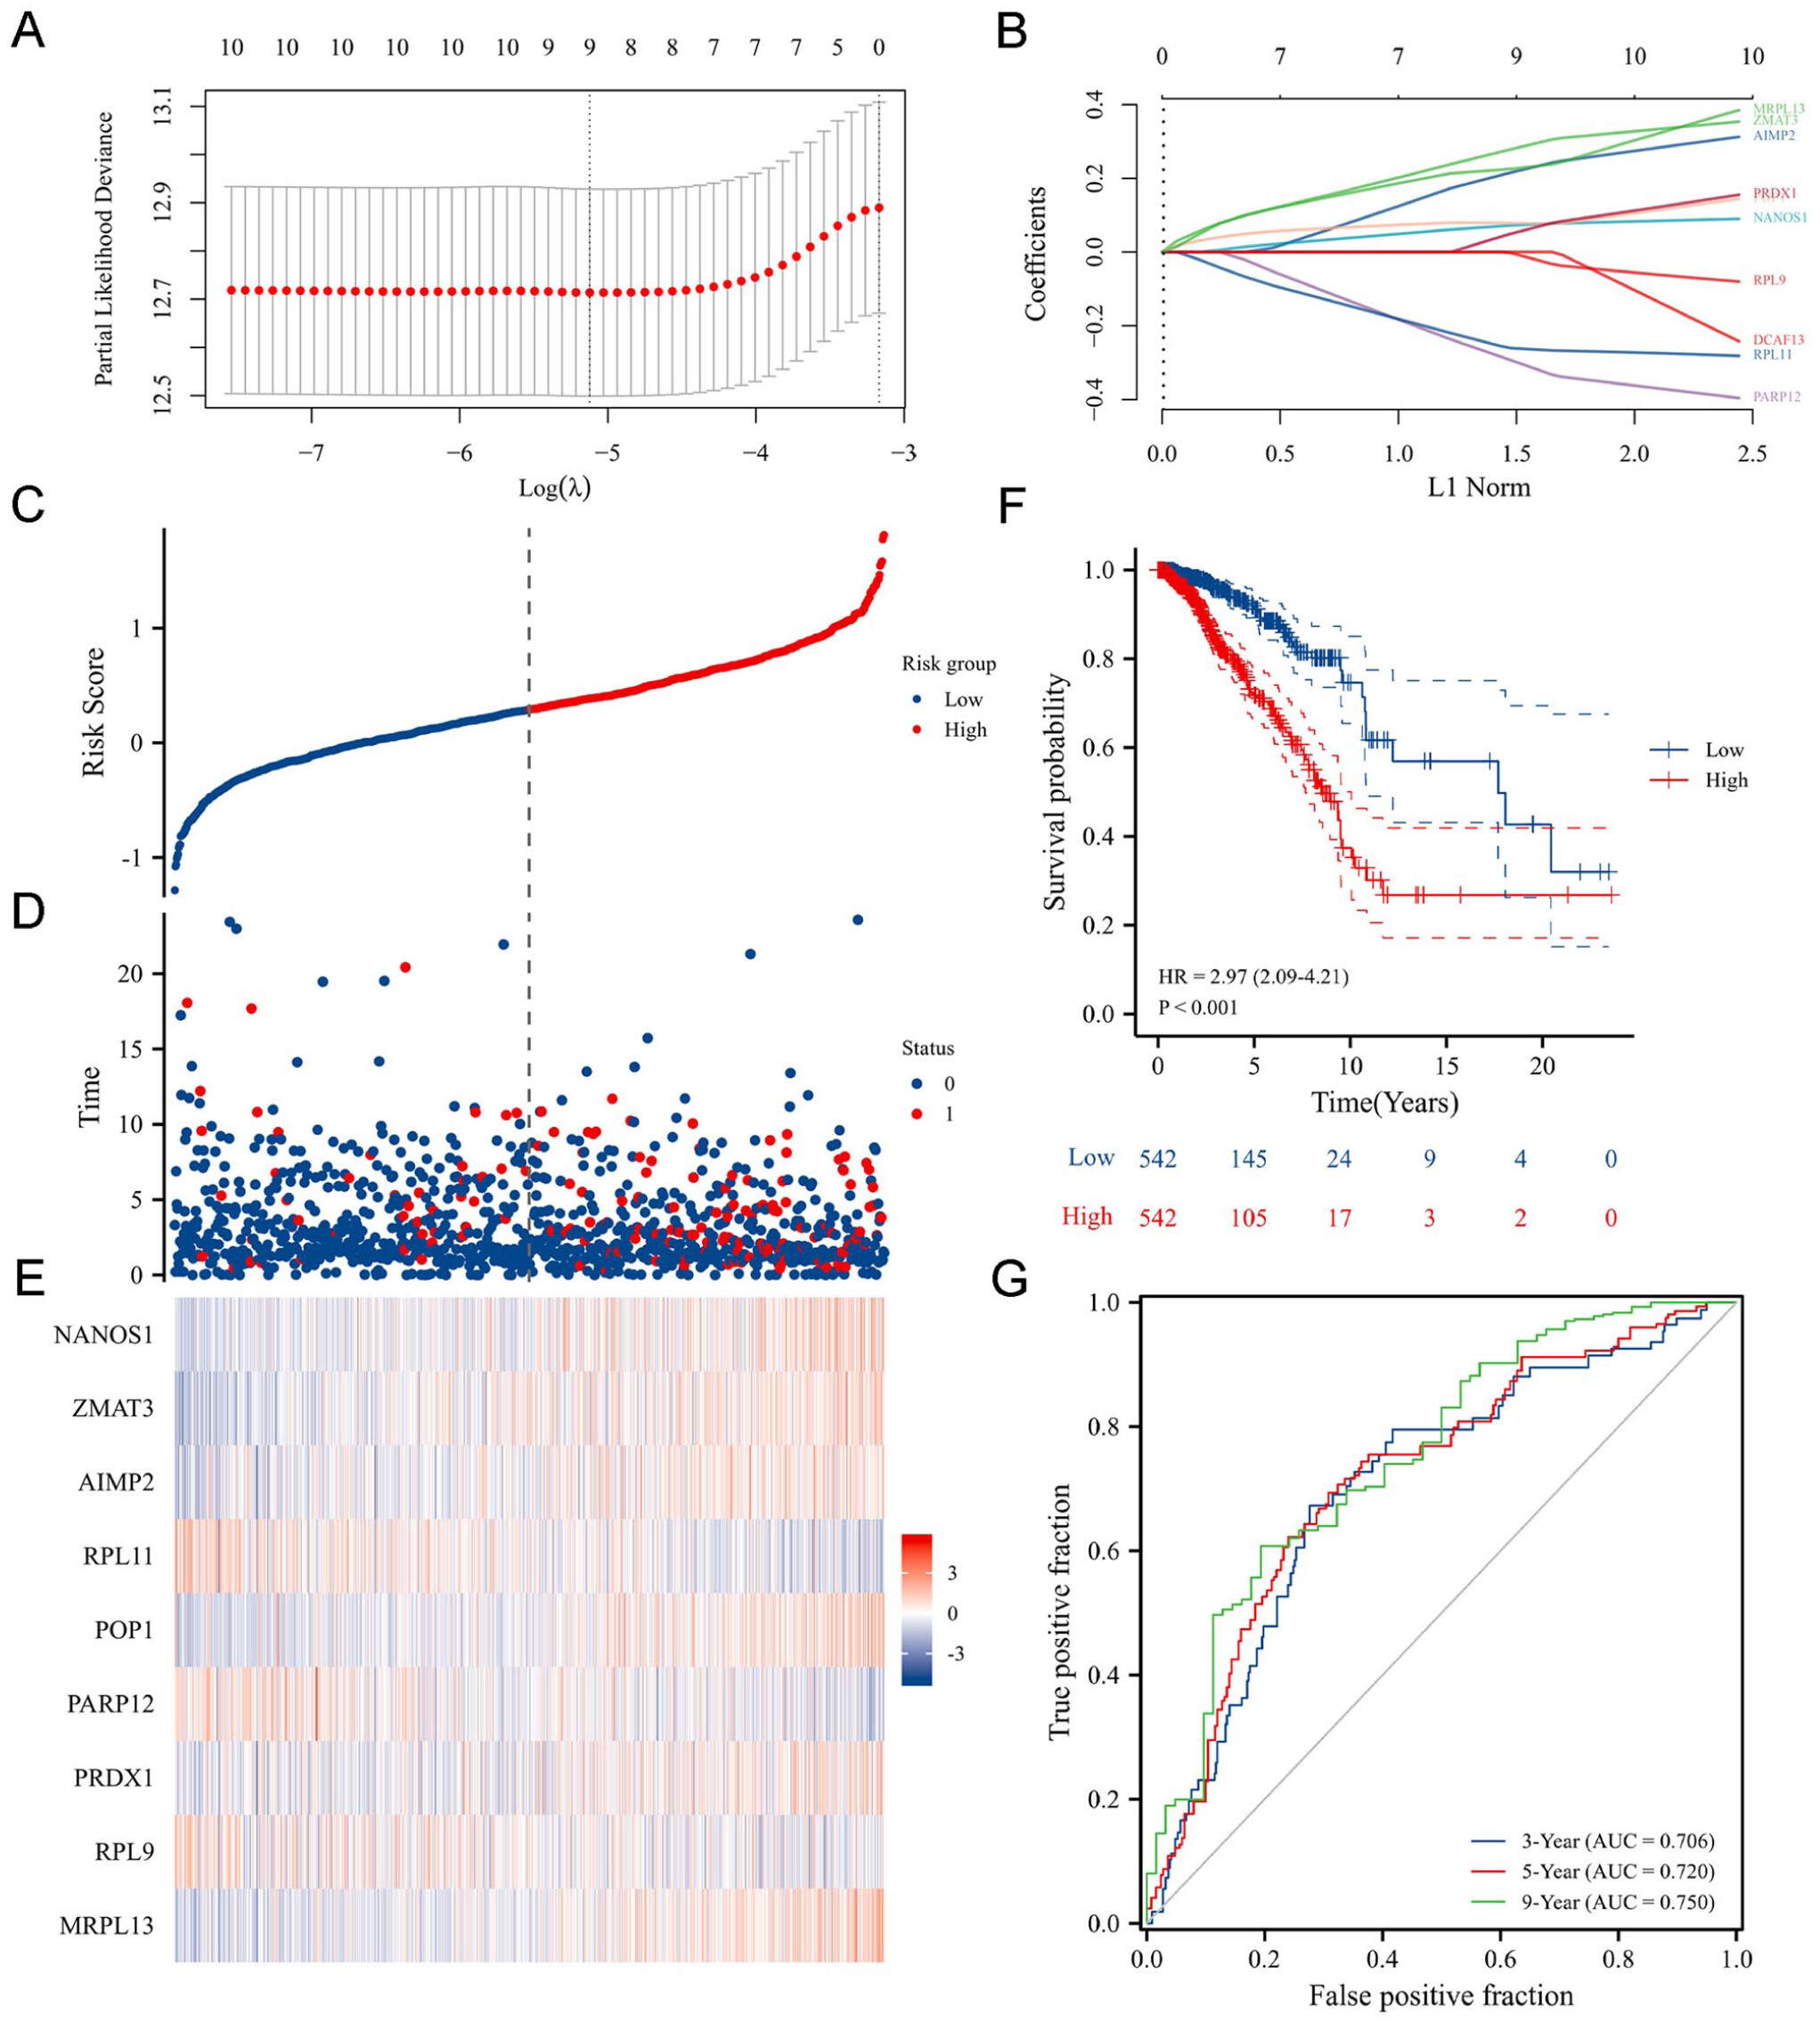
We used algorithms like “LASSO regression analysis” to select differentially expressed RBPs from the RNA-seq and clinical data of 1085 patients from the TCGA-BRCA cohort. LASSO regression analysis with 10-fold cross-validation was used to establish an RBP-based scoring model for predicting patient prognosis. The LASSO method was chosen because it simultaneously performs variable selection and regularization, effectively reducing the dimensionality of high-throughput RNA-seq data while preventing model overfitting. Unlike ridge regression, which only shrinks coefficients, or elastic net, which combines L1 and L2 penalties, LASSO generates sparse solutions by setting uninformative gene coefficients to zero, thereby yielding a concise and interpretable prognostic signature.
The 10-fold CV strategy was selected because it provides an optimal balance between bias and variance and has been widely validated in similar high-dimensional transcriptomic studies. This configuration allows each sample to be used for both training and testing across iterations, ensuring model stability, robustness, and generalizability while maintaining computational efficiency. The choice of 10 folds was therefore methodologically justified rather than arbitrary.
The risk score was calculated as follows:
where β = the coefficient of RBPs. exp = the expression levels of RBPs.
Furthermore, the median risk score was set as the cutoff value to divide the patients with BRCA into high- and low-risk subgroups. Kaplan-Meier (KM) survival analysis was used to determine the performance of the RBP-based scoring model in predicting prognosis. The difference in overall survival (OS) and median survival time was compared in patients of the two subgroups. The differences in clinical characteristics like tumor size, node metastasis, and distant metastasis of patients in the two subgroups were compared. Univariate Cox regression analysis and the log-rank test were used for calculating HR, 95% CI, and
P-values. The “survival” R package was used to plot KM survival curves. The “ggplot” R package was used to create the scatter plots of risk scores, heatmaps of RBP gene expression, and subgroup comparison plots. The “time ROC” R package was used to create the time-dependent ROC curves.
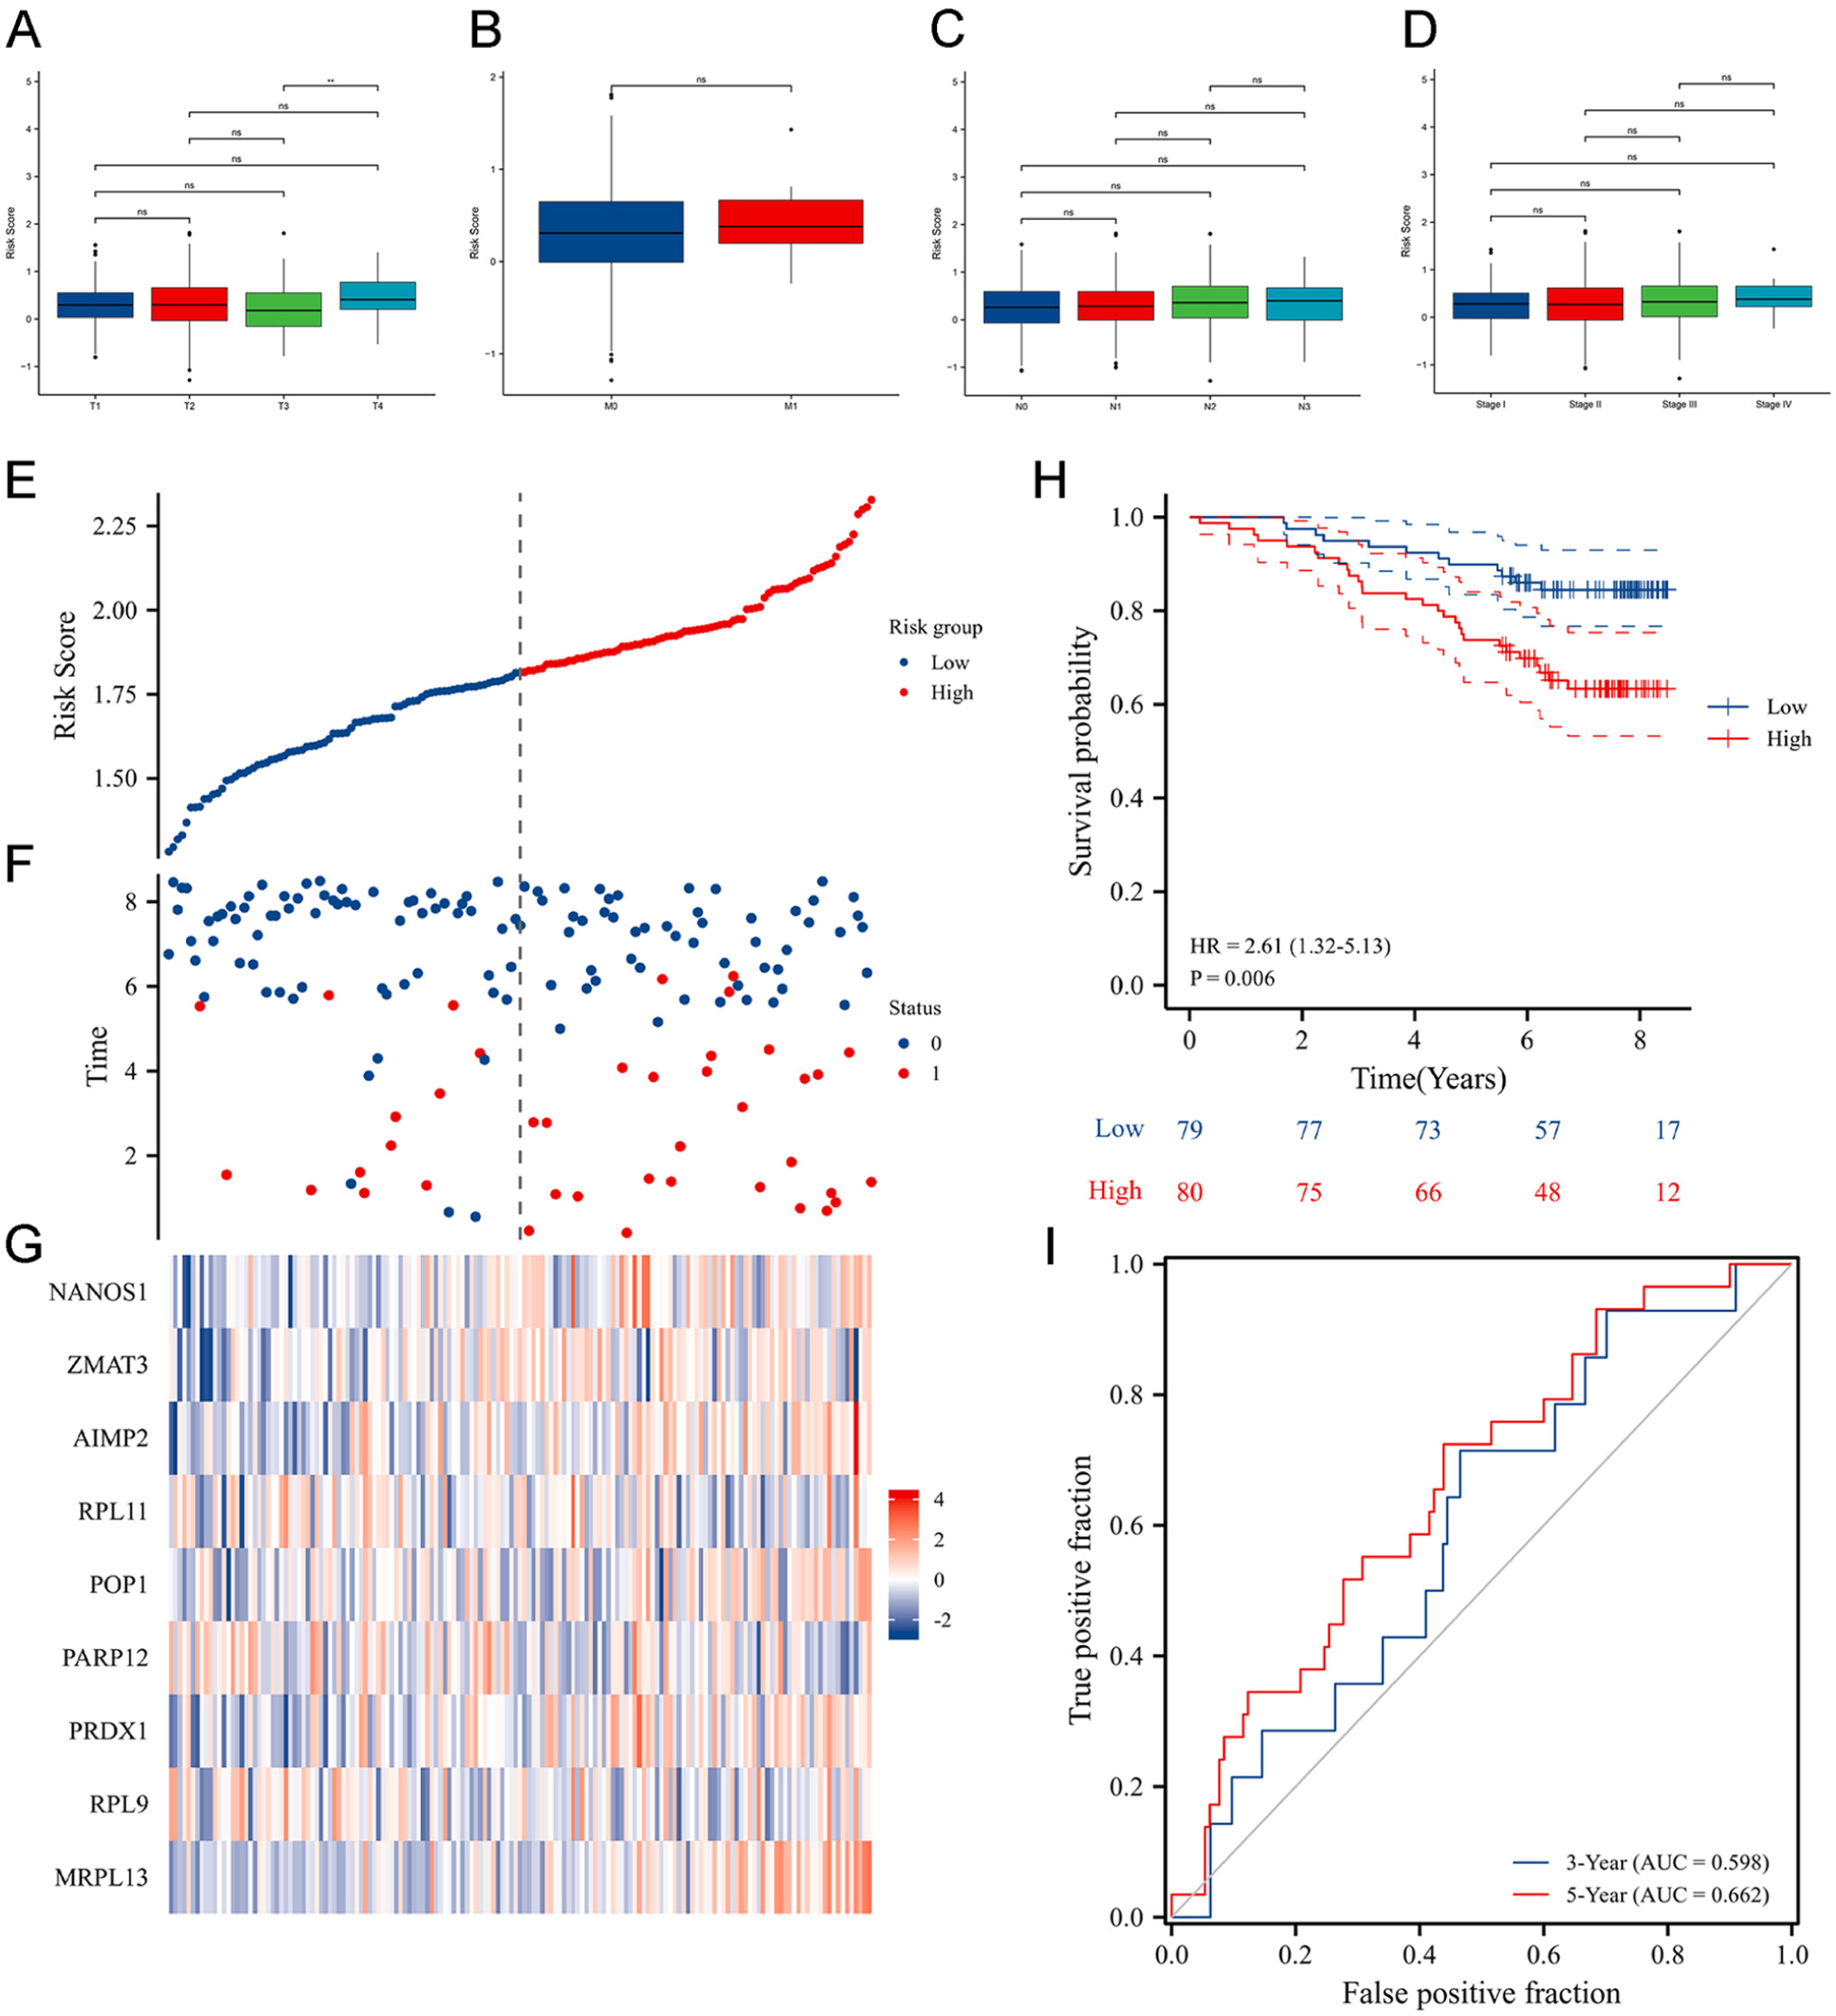
26Verification of the RBP-based scoring model
To comprehensively evaluate the generalizability, stability, and reproducibility of the RBP-based prognostic model, we employed a two-step validation strategy. First, internal 10-fold cross-validation was performed during LASSO regression in the TCGA-BRCA training cohort to ensure optimal feature selection, minimize overfitting, and confirm internal consistency. Second, the finalized model was independently validated using the external GSE1456 dataset (n = 159) obtained from the GEO database. The risk scores of patients in the validation cohort were calculated using the same coefficients derived from the TCGA-BRCA cohort without retraining. The model’s predictive performance was then evaluated through Kaplan–Meier survival analysis and time-dependent receiver operating characteristic (ROC) curve analysis. The consistent separation of high- and low-risk groups, together with comparable AUC values in both the training and validation cohorts, confirmed the robustness, stability, and reproducibility of the RBP-based scoring model. We calculated the risk score of the patient according to the risk scoring model. The median risk score was set as the cutoff value for classifying the patients into high- and low-risk subgroups. The difference in survival of patients in both subgroups was validated. The median cutoff was chosen as it provides a data-driven, non-parametric, and model-independent threshold, ensuring balanced sample sizes and minimizing bias or overfitting. Although alternative approaches, such as maximally selected rank statistics (MaxStat) or ROC-based methods, can determine data-specific optimal cutoffs, these approaches may yield unstable thresholds across independent datasets. The use of the median value therefore ensured consistency, reproducibility, and comparability between the TCGA-BRCA training and GSE1456 validation cohorts.
Construction of protein-protein interaction (PPI) network
The Search Tool for the Retrieval of Interacting Genes/Proteins STRING database (
https://string-db.org) was used to analyze the PPIs between the RBPs of the scoring model. The analysis of functional PPIs will provide insights into the intrinsic functions of the model and aid in identifying functional associations between proteins at the genome level. Cytoscape 3.9.0 (
https://cytoscape.org/) software was used for network visualization and enrichment analysis of the results obtained using the STRING database.
Establishment of a clinical prognostic nomogram
We used Cox regression analyses for screening clinical features associated with the patient’s survival. These clinical features were used to construct a clinical prognostic nomogram for predicting the 3-, 5-, and 9-year survival of patients with BRCA. We plotted calibration curves to estimate the accuracy of the clinical prognostic nomogram for predicting the survival rates of patients with the actual survival rates of the patients. We used the “rms (
https://CRAN.R-project.org/package=rms)” and the “survival” packages for constructing the clinical prognostic nomogram and plotting the calibration curves.
Analyzing the Human protein atlas (HPA) database
We determined the expression of nine prognosis-related differentially expressed RBPs in patients with BRCA using the HPA database (
https://www.proteinatlas.org/). The “KM Plotter (
https://kmplot.com/analysis/)” was used to determine the roles of nine prognosis-related differentially expressed RBPs in patients’ prognoses.
27Immunohistochemical (IHC) experiments
Paraffin-embedded tissue blocks were sectioned into 5 μm-thick slices. The sections were sequentially immersed in Xylene I and Xylene II for 20 min each. Subsequently, the sections were dehydrated through a graded alcohol series by incubating 100%, 95%, and 90% ethanol for 10 min each. Antigen retrieval was performed by submerging the sections in EDTA antigen retrieval buffer followed by high-temperature microwave treatment for 25 min. The sections were then rinsed with phosphate-buffered saline (PBS). Next, 100 μL of bovine serum albumin (BSA) solution was applied to each section for blocking at room temperature for 30 min. Diluted primary antibody was added to the tissue sections and incubated at room temperature for 1.5 h. A secondary antibody was subsequently applied, and the slides were incubated for 45 min at room temperature. Prepared 3,3′-diaminobenzidine (DAB) solution was applied to the sections and incubated for 3–5 min. The sections were counterstained with hematoxylin via dropwise application for 2–5 min, followed by immersion in hydrochloric acid-alcohol for 10–20 s. Finally, the sections were rehydrated through a reverse graded alcohol series for 15 min each and cleared in Xylene II and Xylene I for 5 min each. The slides were mounted with neutral balsam for microscopic analysis.
Reverse transcription quantitative polymerase chain reaction (RT-qPCR) analysis
RT-qPCR was executed to measure AIMP2 and RPL9 mRNA expression levels in clinical BRCA tissue samples. Total RNA was extracted from the tissue samples utilizing TRIzol reagent (Invitrogen). Complementary DNA was generated utilizing the PrimeScript RT Reagent Kit (TaKaRa, Japan). RT-qPCR was then performed with ChamQ Universal SYBR qPCR Master Mix (Vazyme Biotech Co., Ltd, Nanjing, China) and specific primers on an ABI 7500 HT system. The mRNA expression levels were determined using the 2−ΔΔCT method. GAPDH was employed as a normalization control. The primer sequences used in RT-qPCR are provided in
Table 1.
Western blot analysis
Total protein was procured from cells utilizing radioimmunoprecipitation assay lysis buffer (Beyotime) comprising protease inhibitor (HY-K0010; MCE), phosphatase inhibitor (HY-K0021; MCE), and phenylmethylsulfonyl fluoride (Beyotime, Shanghai, China). The protein content was determined utilizing the Pierce bicinchoninic acid Protein Assay Kit (Thermo Fisher Scientific, Waltham, MA) according to the manufacturer’s protocol. The proteins underwent separation through 10% sodium dodecyl sulfate-polyacrylamide gel electrophoresis and were transferred onto polyvinylidene difluoride membranes (Merck, China) by electrophoresis. The membranes were blocked with 5% BSA (Servicebio, China) to prevent non-specific binding, succeeded by washing steps. The membranes underwent overnight incubation with primary antibodies at 4°C. Following washing, the membranes were treated with horseradish peroxidase-conjugated goat anti-rabbit (1:10,000, Abcam, ab6789) or goat anti-mouse (1:10,000, Abcam, ab6721) immunoglobulin G antibodies for 1.5 hours. Immunoreactive bands were visualized using enhanced chemiluminescence. Primary antibodies, Anti-AIMP2 Rabbit Polyclonal Antibody (HA500461) was purchased from HuaAn Biological Technology Co., Ltd. RPL9 Monoclonal antibody (68054-1-Ig) and anti-Beta Tubulin (66009-1-Ig), were obtained from Proteintech Technology (Proteintech, China).
Cell lines and cell culture
The BRCA cell lines and the human normal mammary epithelial cell line MCF10A are widely utilized human cellular models. The breast cancer cell lines ZR-75-1, MCF7, JIMT-1, MDA-MB-231, MDA-MB-468, and SK-BR-3 were procured from the Cell Bank of the Chinese Academy of Sciences (Shanghai, China). MCF10A cells were obtained from Procell Life Science & Technology Co., Ltd. (Wuhan, China). Human BRCA cells were cultured in L15, DMEM, 1640, or McCoy’s 5A medium (BasalMedia, Shanghai, China) supplemented with 10% fetal bovine serum (FBS; Sigma-Aldrich, Uruguayan) and 1% penicillin-streptomycin (HyClone, Logan, USA) at 37°C under 5% CO2. MCF10A cells were maintained in MCF10A-specific complete growth medium, composed of DMEM/F12 basal medium, 5% horse serum (HS), 20 ng/mL epidermal growth factor (EGF), 0.5 μg/mL hydrocortisone, 10 μg/mL insulin, and 1% nonessential amino acids (NEAA).
Cell transfection
RPL9-targeting siRNA and normal control (NC) siRNA were purchased from Obio Technology (Shanghai, China). The sequence for RPL9-targeting siRNA was 5’-CAGCAAGCCACAACAGUUATT-3’, and for NC siRNA was 5’-UUCUCCGAACGUGUCACGUTT-3’. The information for RPL9 overexpression vector was: pLV[Exp]-CMV>hRPL9[NM_001024921.4]-EF1A>GFP:T2A:Puro-WPRE, which was purchased from Hunan Haixing Biotechnology Co., Ltd (Hunan, China). As for the specific transfection process: Related BRCA cells were trypsinized, centrifuged, and uniformy seeded into a six well plate. The transfection was performed via transfection reagent Lipofectamine™ 3000 (Thermo Fisher Scientific, #L3000008), following the instructions.
CCK-8 cell proliferation assay
Cell proliferation was assessed using the Cell Counting Kit-8 (CCK-8; Biosharp, BS350A) essay to determine the effect of RPL9 expression on BRCA cell growth. Both MCF7 (luminal A) and JIMT-1 (HER2-positive) cell lines were used to ensure that the results were reproducible across different BRCA subtypes. Cells with RPL9 overexpression (OE) or RPL9 knockdown (siRNA), along with corresponding control groups, were seeded into 96-well plates at a density of 5 × 10³ cells/well. Cell viability was recorded at 0, 24, 48, 72, and 96 hours after seeding by adding 10 µL of CCK-8 solution per well and incubating for 2 hours at 37 °C. The absorbance of 450 nm was measured using a microplate reader, and data were collected from at least three independent biological replicates. The proliferation curves were plotted relative to the 0-h optical density, and statistical significance was analyzed using T-test.
Calculation of tumor mutational burden
TMB was calculated for each patient in the TCGA-BRCA cohort using the “maftools” R package based on somatic mutation data obtained from the TCGA database.
28 TMB was defined as the total number of nonsynonymous somatic mutations (including single-nucleotide variants, insertions, and deletions) per million bases within the coding region of the genome, normalized to mutations per mega base (mut/Mb) following the TCGA bioinformatics workflow.
29 To ensure comparability across samples, mutations with low sequencing quality or noncoding variants were excluded. The median TMB value of the entire cohort was used as the cutoff threshold to classify patients into high-TMB and low-TMB groups. Similarly, the median risk score derived from the RBP-based prognostic model was employed to define high- and low-risk subgroups. Correlation and survival analyses were subsequently conducted to explore the relationships between TMB and risk scores. The mutation landscape of BRCA samples was visualized using a waterfall plot.
Comprehensive analysis of TIME
TIME is primarily composed of stromal and immune cells. The “Estimation of STromal and Immune cells in MAlignant Tumor tissues using Expression data (ESTIMATE;
https://R-Forge.R-project.org/projects/estimate/)” R package
30 was used to evaluate TME and calculate immune, ESTIMATE, and stromal scores of all patients with BRCA. The “single-sample gene set enrichment analysis” was performed using the “Gene Set Variation Analysis” R package
30 to quantify the relative abundance of the infiltration of 28 types of immune cells in TME. We used the “Cell-type Identification by Estimating Relative Subsets of RNA Transcripts (CIBERSORT)” algorithm to further characterize the infiltration levels of 22 immune cell types in tumors. The gene expression data of patients with BRCA were imported to the CIBERSORTx website (
https://cibersortx.stanford.edu/) for calculation, and the relative scores of 22 types of immune cell infiltrating tumors of patients in the subgroups were compared. Immune checkpoint molecules and immune functions influence the patient’s response to immunotherapy. Therefore, for the purpose of assessing the impact of the risk scores of patients on immunotherapy, we compared differences in immune functions and immune checkpoints among patients in both subgroups. In addition, to assess potential heterogeneity within the high- and low-risk groups, we examined the diversity of immune and stromal cell infiltration patterns, immune checkpoint expression, and ESTIMATE-derived scores within each subgroup. This approach enabled us to evaluate whether biological variability within the subgroups could influence the robustness of the RBP-based scoring model.
Flow cytometry–based apoptosis analysis
Apoptosis was assessed using Annexin V–FITC/PI staining (Vazyme, A211-01) according to the manufacturer’s protocol. After transfection, cells were harvested, washed twice with cold PBS, resuspended in binding buffer, and stained with Annexin V–FITC and propidium iodide for 15 min at room temperature in the dark. Samples were analyzed on a BD FACSCanto II flow cytometer, and data were processed using FlowJo software. Early and late apoptotic cell populations were quantified.
Statistical analysis
The R package (version 4) was used for statistical analysis and data visualization. We used the Kruskal-Wallis or Wilcoxon signed-rank test to analyze data that did not fit a normal distribution or had clear variances. Cox regression models were used to perform univariate and multivariate Cox regression analyses. To verify model validity, the proportional hazards (PH) assumption was assessed using Schoenfeld residuals through the cox.zph function in the “survival” R package. No significant violations of the PH assumption were observed (global test P > 0.05), indicating that the estimated hazard ratios remained constant over time. We used the log-rank tests to assess the survival differences. Spearman’s rank correlation test was used for analyzing the correlations between risk score and infiltrating immune cells.
Discussion
The incidences and mortalities related to BRCA are highest in women among all cancers worldwide.
2 BRCA is a highly heterogeneous tumor; therefore, clinical characteristics like the patient’s age, clinical stage, and tumor classification could predict the prognosis of patients with BRCA.
34 However, these characteristics fail to accurately predict the patient’s prognosis. The advent of high-throughput omics data and bioinformatics technologies has allowed us to screen and identify factors that can predict patient prognosis at the molecular level in an accurate manner. Furthermore, an ideal prognostic model or biomarkers can aid in predicting the survival of patients. Recent studies have shown a close correlation between RBPs and BRCA development and progression. In fact, studies have demonstrated the involvement of RBPs in several processes like angiogenesis, apoptosis, invasion, migration, and metastasis of cancer cells.
35–38In this study, we have integrated gene expression and clinical data of patients in the TCGA-BRCA cohort and identified 11 prognosis-related differentially expressed RBPs. We screened nine prognosis-related differentially expressed RBPs using LASSO regression analysis, and an RBP-based scoring model was constructed for predicting the OS of patients with BRCA. Based on the RBP-based scoring model, the survival analysis results revealed significant differences in the OS of patients in both subgroups. The survival of patients in the low-risk subgroup was better compared to the high-risk subgroup. ROC curves showed that the RBP-based scoring model has better accuracy in predicting the OS of patients with a higher confidence interval. The AUC values were >0.7 for 3-, 5-, and 9-years postoperative survival of patients. Our results indicated that the RBP-based scoring model accurately predicted patient’s survival. The performance of our model was comparable to the predictive performance of TNM staging in BRCA. In addition, the validation cohort further confirmed the accuracy of the RBP-based scoring model. Meanwhile, we also constructed a prognostic prediction nomogram. Compared to a single clinicopathological parameter, the clinical nomogram constructed using the RBP-based scoring model and multiple clinical characteristics could more effectively and precisely predict the prognosis of patients with BRCA. To contextualize performance, our RBP-based signature yielded time-dependent ROC’s AUCs of 0.706, 0.720, and 0.750 for 3-, 5-, and 9-year OS in TCGA-BRCA, with consistent KM separation and external reproduction. These values are comparable to representative m
6A-related lncRNA models (AUC = 0.772 in training and 0.698 in validation),
39 immune-related signatures that can achieve higher short-term AUCs in TNBC (e.g., 1-, 3-, and 5-year AUCs of 0.835, 0.852, and 0.843),
40 and metabolism-based models reporting overall AUC ≈ 0.75 (e.g., 0.756; 1-year 0.792; 5-year 0.776) with external validation.
41 For broader reference, clinicopathologic nomograms frequently show C-indices around 0.74–0.81 in breast cancer cohorts (e.g., 0.759, 95% CI 0.715–0.802; and 0.767, 95% CI 0.751–0.775), supporting that our discrimination metrics lie within the expected range for contemporary prognostic tools while adding biological interpretability through RBP-driven pathways.
42As for the nine prognosis-related differentially expressed RBPs which play significant roles in tumorigenesis, a study has shown the involvement of AIMP2 in regulating cell death
43 and has anti-proliferative activity. AIMP2 attenuates the growth of cells by triggering cell cycle arrest via the TGF-β signaling pathway. Additionally, AIMP2 activates the p53 and TNF-α apoptosis pathway to promote cell death.
44 Besides, tumor tissues harbor AIMP2 splice variants that disrupt normal AIMP2 function and induce tumorigenesis.
45 Another study has shown that in hepatocellular carcinoma, the deficiency of PARP12 promotes cell migration, invasion, and metastasis.
46 The prognosis of patients with BRCA with high MRPL13 expression was poorer. MRPL13 could promote proliferation, migration, and epithelial-mesenchymal transition of BRCA cells via the PI3K-AKT-mTOR pathway.
47,48 PRDX1 also plays several roles in BRCA. PRDX1 inhibits tumorigenesis by binding to PTEN, thereby preventing the inactivation of PTEN via oxidation.
49 Further, PRDX1 suppresses the activation phenotype of fibroblasts in mammary glands via regulating the JNK kinase signaling.
50 In addition, under oxidative stress, PRDX1-overexpressing NK cells show strong anti-tumor activity in BRCA cells.
51 The knockdown of RPL9 expression inactivates the Id-1/NF-κB signaling pathway, thus attenuating the growth of colon cancer cells.
52 A study has shown the involvement of RPL11 in the MDM2-p53 signaling pathway. MDM2 binds to RPL11, inactivates MDM2, and activates p53, thereby inhibiting tumorigenesis and cancer progression.
53 ZMAT3 is an important RNA splicing and homeostasis regulator. As an important downstream splicing regulator of p53, ZMAT3 plays an important role in p53-mediated tumor suppression.
54 In particular, our study is the first to report the critical roles of the RPL9 in both BRCA prognosis and its anti-proliferative capacity of BRCA cells.
Accumulating evidence suggests that RPL9 may exert diverse biological functions depending on tumor type and cellular context. In colorectal carcinoma, RPL9 overexpression has been linked to enhanced proliferation and migration through activation of the Id-1/NF-κB pathway, where its knockdown suppresses xenograft growth and downregulates pro-survival signaling.
52 Similar oncogenic implications were observed in glioma and hepatocellular carcinoma, in which RPL9 upregulation correlated with advanced TNM stage and poor survival, suggesting that RPL9 may facilitate ribosomal biogenesis and translational efficiency in rapidly proliferating cells.
55,56 In contrast, studies on B-cell acute lymphoblastic leukemia have shown that RPL9 suppresses leukemia progression by inducing nucleolar stress and mitochondrial dysfunction, suggesting that it may exert tumor-suppressive effects through ribosomal stress and p53 activation.
57 These seemingly contradictory observations indicate that RPL9’s function is context-dependent, potentially influenced by tissue-specific metabolic demand and the balance between ribosomal protein–mediated p53 stabilization and NF-κB–driven proliferation.
58–60 Given the established crosstalk between the p53 and NF-κB pathways, the balance regulated by RPL9 could represent a crucial checkpoint in tumor cell fate. Mechanistically, the loss of RPL9 may compromise ribosomal integrity and induce ribosomal stress, leading to the sequestration of MDM2 and subsequent stabilization and activation of p53, which triggers transcription of pro-apoptotic genes such as BAX, PUMA, and NOXA.
53,59 Conversely, RPL9 deficiency may also disrupt the translation of key regulators involved in cell-cycle control and DNA repair, resulting in uncontrolled proliferation and genomic instability. In addition, accumulating evidence suggests that RPL9 modulates NF-κB signaling, where reduced RPL9 expression leads to sustained NF-κB activation and upregulation of anti-apoptotic genes (BCL2, XIAP, MCL1), while RPL9 restoration can suppress this pathway, thereby enhancing apoptosis and growth inhibition.
52,61 Beyond transcriptional regulation, RPL9 may influence mitochondrial homeostasis and oxidative stress. Depletion of RPL9 has been linked to mitochondrial dysfunction, excessive reactive oxygen species (ROS) accumulation, and metabolic reprogramming favoring tumor survival.
57,58,62 Therefore, RPL9 may act as a multifaceted regulator that integrates ribosomal biogenesis stress responses, mitochondrial stability, and inflammatory signaling, collectively constraining malignant progression in BRCA. Future investigations employing rescue experiments, pathway inhibition assays, and co-immunoprecipitation of RPL9 with MDM2 or NF-κB subunits will be critical to verify these proposed mechanisms and delineate the precise molecular circuitry underlying RPL9-mediated tumor suppression.
Collectively, these nine RBPs demonstrate mechanistic links to the biological hallmarks of BRCA. MRPL13 and AIMP2 promote tumor growth and epithelial–mesenchymal transition via activation of the PI3K–AKT–mTOR and TGF-β/p53 signaling pathways, whereas PRDX1 maintains redox homeostasis and suppresses tumorigenesis by stabilizing PTEN activity. ZMAT3 and RPL11 function as critical downstream regulators of the p53 axis, and their dysregulation may impair apoptosis and genomic stability. In contrast, RPL9 exhibits tumor-suppressive properties, as confirmed by our functional assays, while PARP12 inhibits migration and metastasis in multiple cancers. POP1 and NANOS1 are RNA-processing factors implicated in stemness and cellular differentiation. These complementary oncogenic and tumor-suppressive roles collectively enhance the biological plausibility and predictive robustness of the RBP-based prognostic model, which integrates distinct facets of post-transcriptional regulation, metabolic adaptation, and stress response pathways relevant to BRCA progression.
Genetic mutations play a significant role in tumorigenesis. Our results show that patients in the high-risk subgroup had a higher TMB, and the number of gene mutations increases as the risk score increase. TP53, PIK3CA, TTN, CDH1, and GATA3 were the top five frequently mutated genes in patients with BRCA. Studies have shown mutations in TP53 in several cancers, including BRCA. During DNA damage, TP53 halts the cell cycle process; however, if TP53 is mutated, the cell cycle does not halt, even in case of damage, and the mutated DNA continues to replicate, which leads to uncontrolled cell proliferation and tumorigenesis.
63 Our results confirmed that the prognosis of patients in the high-risk and high-TMB subgroups was poor.
TME is composed of various cells like proliferating tumor cells, surrounding stromal cells, infiltrating immune cells, and inflammatory molecules. Studies have shown the significance of TME in tumorigenesis.
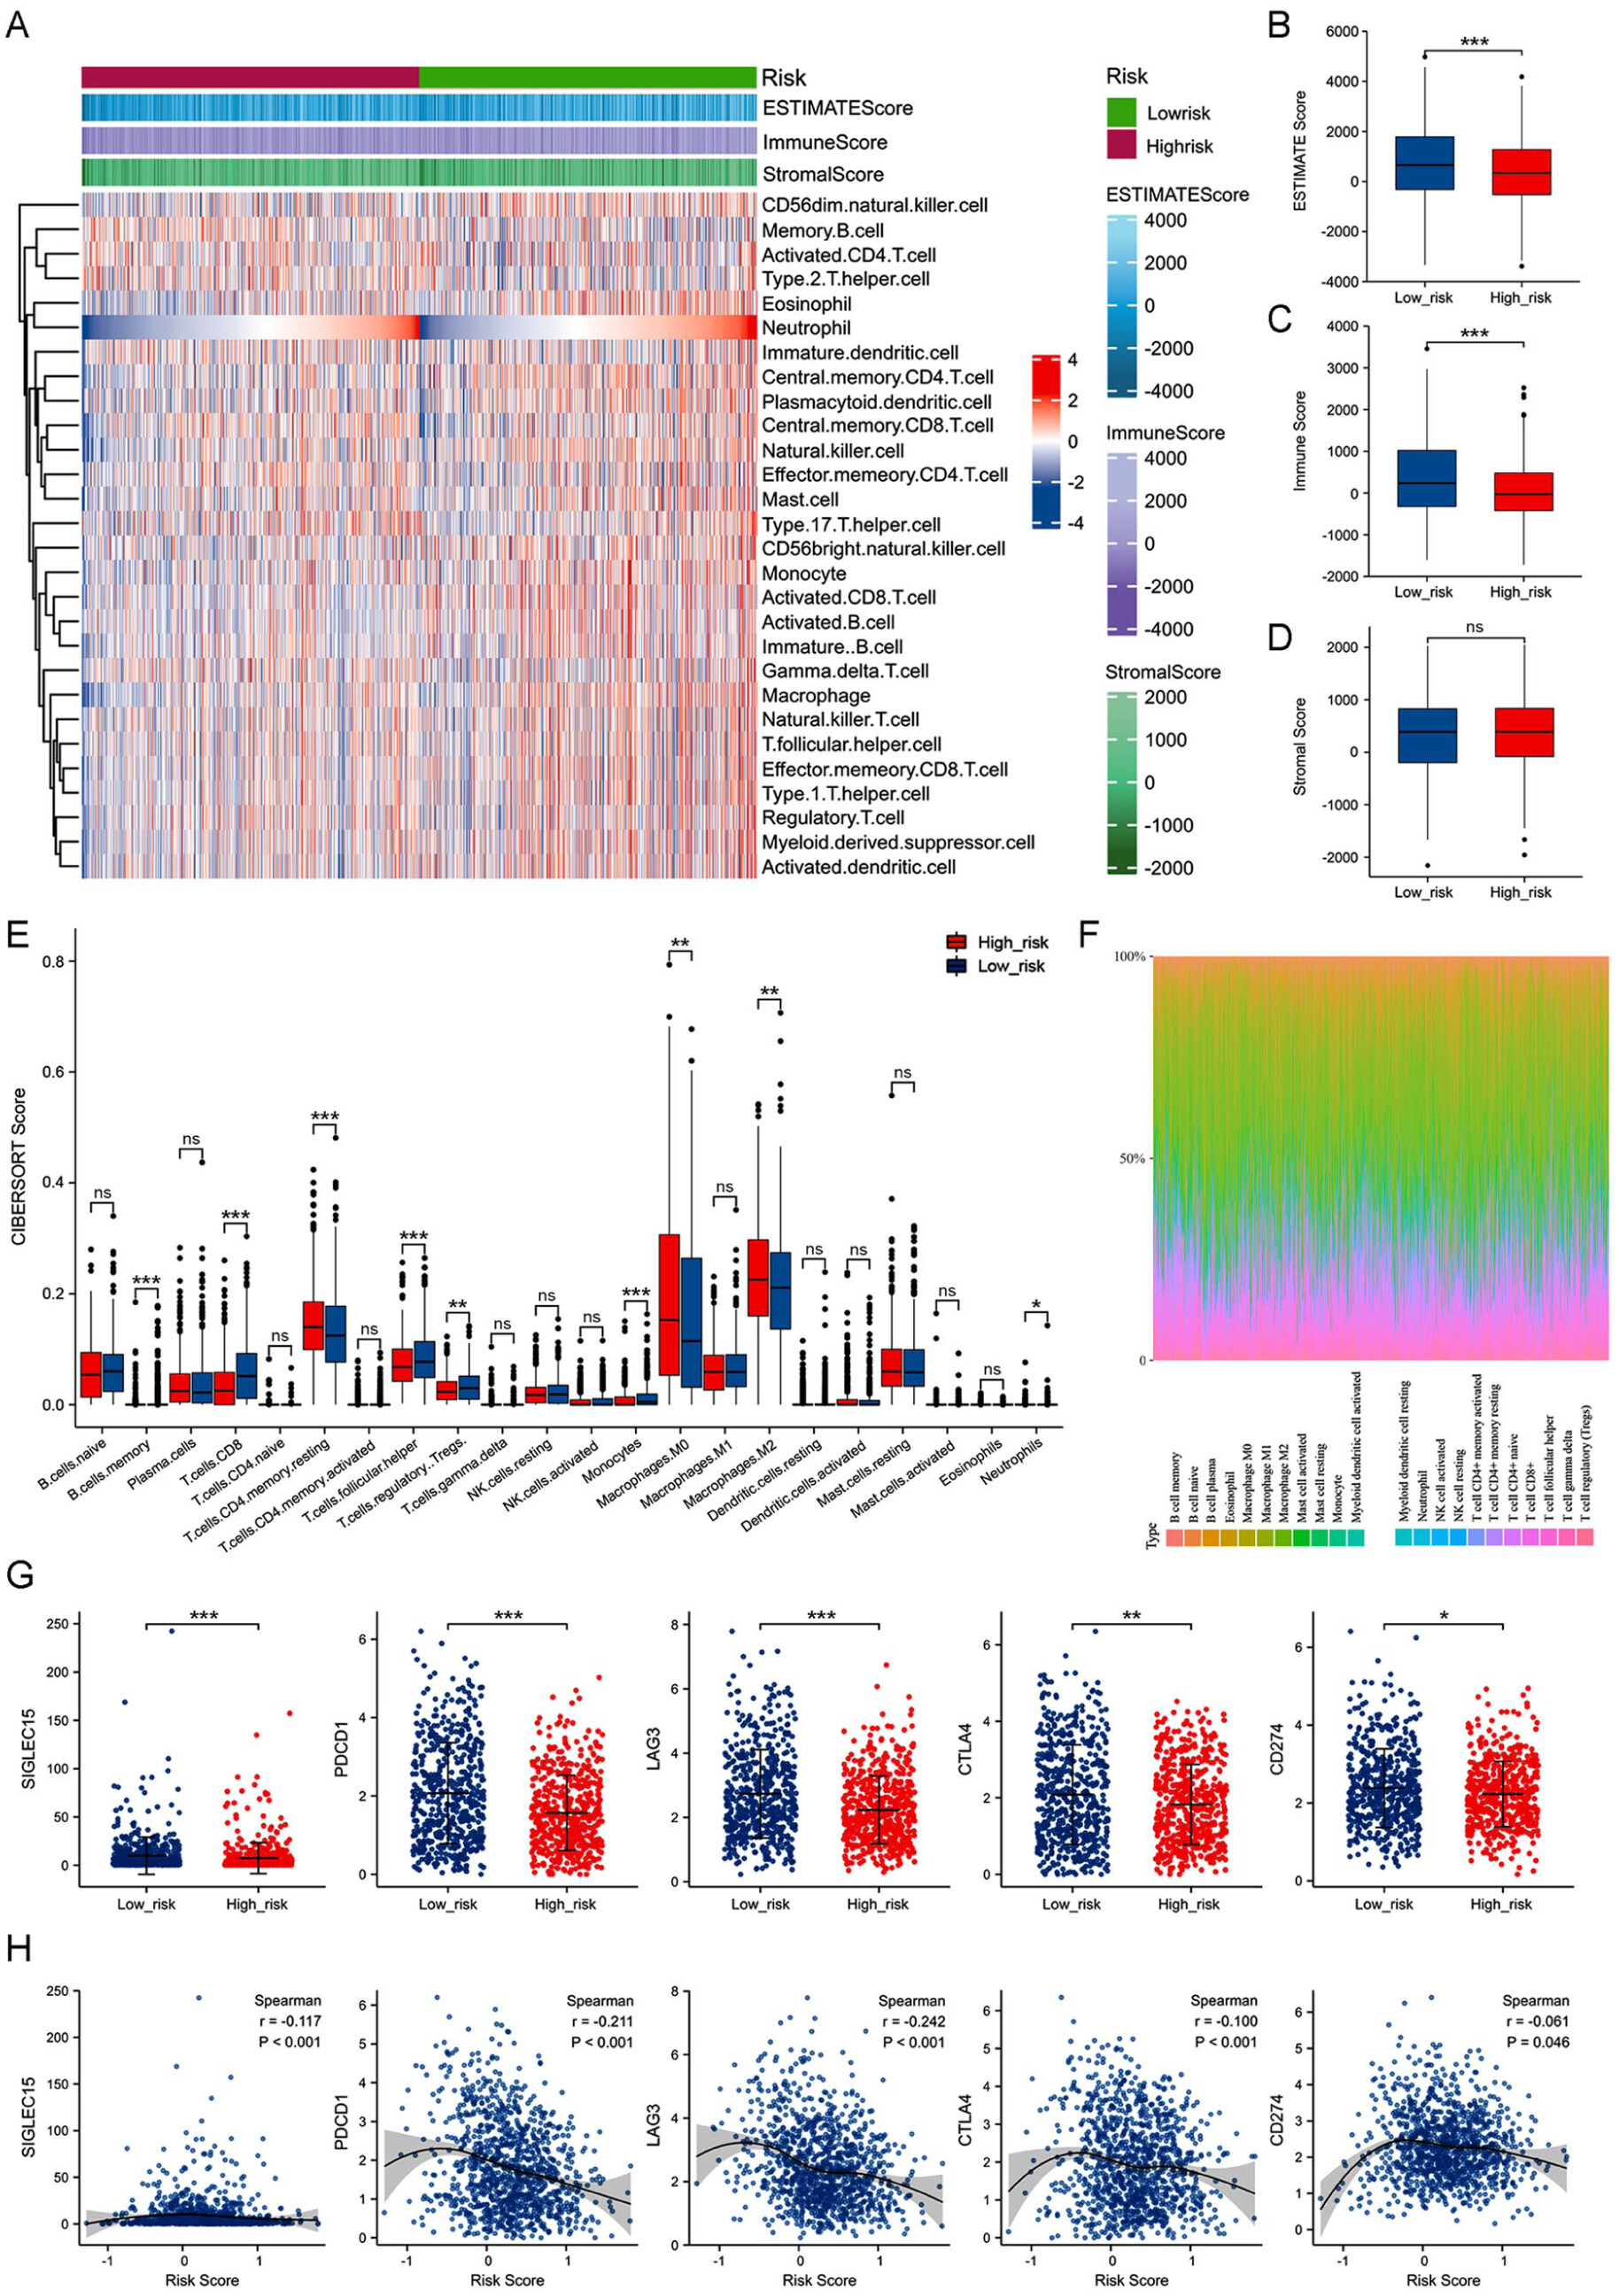
61,62,64 Our results revealed differences in immune scores and the expression of immune checkpoint genes in the TME of patients in both subgroups. Beyond inter-group differences, we also evaluated the potential heterogeneity within each subgroup. The distribution of immune and stromal components, as well as immune checkpoint expression, varied among patients within both the high- and low-risk groups, indicating that the RBP-based scoring model captures intrinsic biological diversity rather than reflecting a single subtype bias. Moreover, the model’s consistent prognostic performance in the external validation cohort further demonstrates its robustness and applicability across heterogeneous patient populations. The immune scores of patients in the high-risk subgroup were low. A previous study has shown a significant positive correlation between the immune scores and the prognosis of patients with cancers,
65 consistent with our results. Immune cells like tumor-infiltrating lymphocytes are important components of TME. The density and type of TILs are strongly correlated with the prognosis of patients with BRCA.
66 Studies have shown that tumor-infiltrating CD8
+ T cells function as effector cells, target tumor cells, and induce tumor cell death, thereby improving clinical outcomes in patients with BRCA.
67,68 Low CD8
+ T cell infiltration level in TME patients in the high-risk subgroup was observed, indicating that the prognosis of patients in this subgroup was poor. Furthermore, tumor-associated macrophages participate in tumor cell growth, invasion, and metastasis, thereby contributing to the progression of BRCA.
69 Macrophages can be polarized into M1 and M2 states. TME significantly contributes to macrophage polarization, and different TME can polarize M0 macrophages into either M1 or M2 states, thereby producing opposite effects. M1 macrophages contribute to anti-tumor immune responses, while M2 macrophages aid in cancer progression and drug resistance.
69 The infiltration of M2 macrophages in patients in the high-risk subgroup accelerates disease progression, which could be the underlying cause of the poor prognosis of patients in this subgroup. Furthermore, our results showed that the expression profiles of immune checkpoint genes were negatively correlated with the risk scores of patients, which indicates that the patients with low scores may show a better response to immunotherapy and have better clinical outcomes.
A noteworthy point is that the immune landscape analysis revealed that the RBP-based high-risk group displayed significantly lower immune and ESTIMATE scores, reduced infiltration of cytotoxic CD8⁺ T cells, and downregulation of multiple immune checkpoint molecules (PDCD1, CD274, CTLA4, and LAG3), suggesting a non–T-cell–inflamed (immune-cold) microenvironment.
70–72 Mechanistically, this pattern may arise from RBP-mediated transcriptomic dysregulation, as several cancer-associated RBPs (e.g., ELAVL1, IGF2BP1, HNRNPA1) can stabilize oncogenic or metabolic mRNAs while destabilizing immune-related transcripts, thereby impairing antigen presentation and IFN-γ–induced immune activation.
73–77 Consequently, the diminished immune engagement leads to lower checkpoint expression—not due to loss of immune evasion, but because of insufficient immune activation.
78,79 From a clinical perspective, such an immune-cold, low-checkpoint phenotype implies that patients classified as high-risk by our RBP signature may respond poorly to immune-checkpoint blockade monotherapy. This notion is supported by results from IMpassion130 and KEYNOTE-355, which demonstrated that PD-L1–positive, TIL-rich TNBC subgroups experienced the most substantial benefit from PD-1/PD-L1 inhibition.
80–82 Therefore, combination strategies that “heat up” the tumor microenvironment—including chemotherapy, radiotherapy, or RBP-targeted epigenetic modulators—may represent promising approaches to sensitize these high-risk tumors to immunotherapy.
83–85Previous prognostic models based on RBPs in breast cancer have primarily relied on large-scale transcriptomic analyses, yet few have undergone biological or functional validation. For example, Fan et al.
86 developed an RBP-related risk model predicting overall survival but did not experimentally confirm the roles of identified RBPs. Similarly, other studies have identified RBP-based signatures associated with immune infiltration patterns. However, the underlying mechanistic links remain largely unexplored.
87,88 Our present nine-RBP model differs from these studies in several important ways. First, it uniquely integrates bioinformatic construction with experimental validation, providing the first evidence that RPL9 exerts a tumor-suppressive role in BRCA by inhibiting proliferation and promoting apoptosis. Second, we extended the conventional RBP-based framework by incorporating tumor mutational burden and TIME analyses, demonstrating that high-risk groups exhibited greater genomic instability and immunosuppressive infiltration. This combined assessment strengthens the clinical relevance of our model by linking RBP dysregulation to immune modulation and potential immunotherapy responsiveness. Third, the composition of our nine-gene panel represents a biologically balanced network that includes both pro-tumor and anti-tumor RBPs. This structure enables our signature to reflect the dual regulatory roles of RBPs in oncogenic and apoptotic processes, thereby enhancing predictive accuracy and biological interpretability. Together, these distinctions justify the novelty of our model, which advances from previous predictive frameworks by bridging computational discovery with functional validation and by providing an integrated view of RBP-driven genomic and immune alterations in BRCA.
In conclusion, our study is the first to construct a scoring model using differentially expressed RBPs associated with prognosis for predicting the survival of patients with BRCA. We construed an RBP-based scoring model based on nine prognosis-related RBPs in patients from the TCGA-BRCA cohort and validated it in an independent cohort obtained from the GEO database. The RBP-based scoring model demonstrated good predictive performance. Furthermore, this study found that RPL9 silence promoted the malignant proliferation of breast cancer cells. However, our study still has a few limitations. Firstly, further validation is needed to assess whether the RBP-based scoring model has the same good validity across BRCA molecular subtypes. Secondly, the RBP-based scoring model was constructed and validated in patients with BRCA merely obtained from publicly available databases, and the data was retrospective. Thirdly, the detailed molecular mechanisms that PRL9 inhibits the development of BRCA need to be explored deeply by in vitro and in vivo assays.