Datasets
The prediction models contain variables from six different sources and include text data as well as variables capturing conflict dynamics and socio-economic and socio-political trends. I use two different text sources for the NLP methods: (1) newspaper articles from the BBC Monitoring (BBC) Dataset (from 2013 to 2020); and (2) expert-written CrisisWatch country reports (2003–2020) from the International Crisis Group. CrisisWatch reports are short, monthly descriptions of conflict-related trends for each country and are freely accessible online.
5 The BBC Data consist of all newspaper articles produced and collected by the BBC Monitoring team, which includes BBC articles but also translations of other international media reporting. It also includes expert reports and analyses, relatively similar to CrisisWatch (CW) reports.
6 As the time period for which I have text data available is different for CW and BBC, I build one dataset that contains features from CW including data from 2003 to 2020 and one dataset that contains features from BBC texts including data from 2013 to 2020.
7In order to predict monthly (log) fatalities, I use the UCDP GED (
Sundberg and Melander, 2013)
8 that contains “individual events of organized violence (phenomena of lethal violence occurring at a given time and place)” that are geo-coded as precisely as possible. In addition, I use the UCDP GED Dataset to extract actor-related features. For the UCDP GED and all following datasets, I extract variables from 2003 until 2020 and either aggregate or interpolate them to a country-month level. As many machine learning methods do not allow for missing observations and timesteps, instead of dropping these observations, I use the Multiple Imputation by Chained Equations approach with the lightgbm algorithm to impute the missing values.
9Features related to civil society and political liberties are taken from the Varieties of Democracy Datset (
Coppedge et al., 2023).
10 The public repository for the Rulers, Elections, and Irregular Governance dataset (
Bell et al., 2021)
11 is utilized for election and leadership variables. Finally, I use the ethnic power relations (EPR) Power Access Data and Conflict Database
12 for power access and information on conflict history. The reader is referred to the Online Appendix for an overview of all variable names as well as which variable is used for which model.
Model specifications
For each prediction task (
t + 1, …,
t + 6) I build an independent prediction model that directly predicts the logarithm of monthly fatalities (on a country level) for the next 1–6 months (direct multi-step forecasting). In order to model the time dependencies, I lag all input features. As I have different time periods available for each text source, I estimate all models for the CrisisWatch dataset and the BBC dataset separately and compare each to how they perform once different text features are added (
Table 1).
This results in a large number of models, since I explore how different text features are able to complement or supplement different categories of base features. In total, I trained 78 (39 BBC and 39 CW) models for the six prediction tasks.
15 For the BBC (CW) models, the time period from 2013 (2003) until 2019 is used to train the models while the year 2020 is the hold-out sample to test the prediction models. For all specifications, a Random Forest model is trained, by employing hyperparameter optimization and cross-validation, and the best-performing model is selected.
16 As a robustness check, I also estimate all models with gradient-boosted decision trees (XGBoost) to rule out that patterns are due to a certain modeling algorithm. In contrast to traditional cross-validation, I cannot randomly split the dataset into train and validation sets as when modeling time dependencies, future values might be used to predict past ones. Therefore, I employ a sliding window approach. For the hyperparameter optimization of the Random Forest model, I use the number of trees and the maximal depth as hyperparameters and employ Bayesian optimization with 30 trials to find the optimal parameter constellations. With regards to the maximal depth, I test configurations between 2 and 32. For the number of regression trees, I test constellations between 100 and 1000. As I train a model for each forecast horizon for all 140 models, I refrain from reporting all ideal hyperparameters for each model but rather report the general trends. For both the BBC and the CW corpus, the smallest depth, namely 2, was chosen in most cases as the ideal hyperparameter. The results for the number of trees vary more, but also, in this case, smaller trees are more frequently chosen. To avoid cross-contamination between the training and test sets I predict only the second half of 2020 as lagged input features are used in the models. Following the prediction task, I evaluate the performance of the models using mean squared error (MSE) and
R2 values for each of the prediction steps. Thereby, I can evaluate which text features can add the most to the more traditional approaches to conflict prediction.
Descriptive statistics
Before describing and comparing the model results, this section will provide more information on the text corpora as well as some descriptive statistics for the text features and the target variable. The two corpora are very different with regard to the following aspects. The CW corpus is considerably smaller. There is only one report for each country-month observation’ consequently, there are approximately 14,000 reports. The BBC corpus contains 1,365,150 newspaper reports; consequently, more computing power is needed to process the texts. However, after combining the two text corpora with the UCDP GED Dataset (
Sundberg and Melander, 2013), the total number of observations is around twice as large for the CW data (with 23,773 observations) compared with the BBC data (13,284 observations). The relatively short time period that I can cover with the BBC data may pose a problem as conflicts are relatively rare and could potentially bias the results in favor of CrisisWatch reports. Another difference is the country coverage.
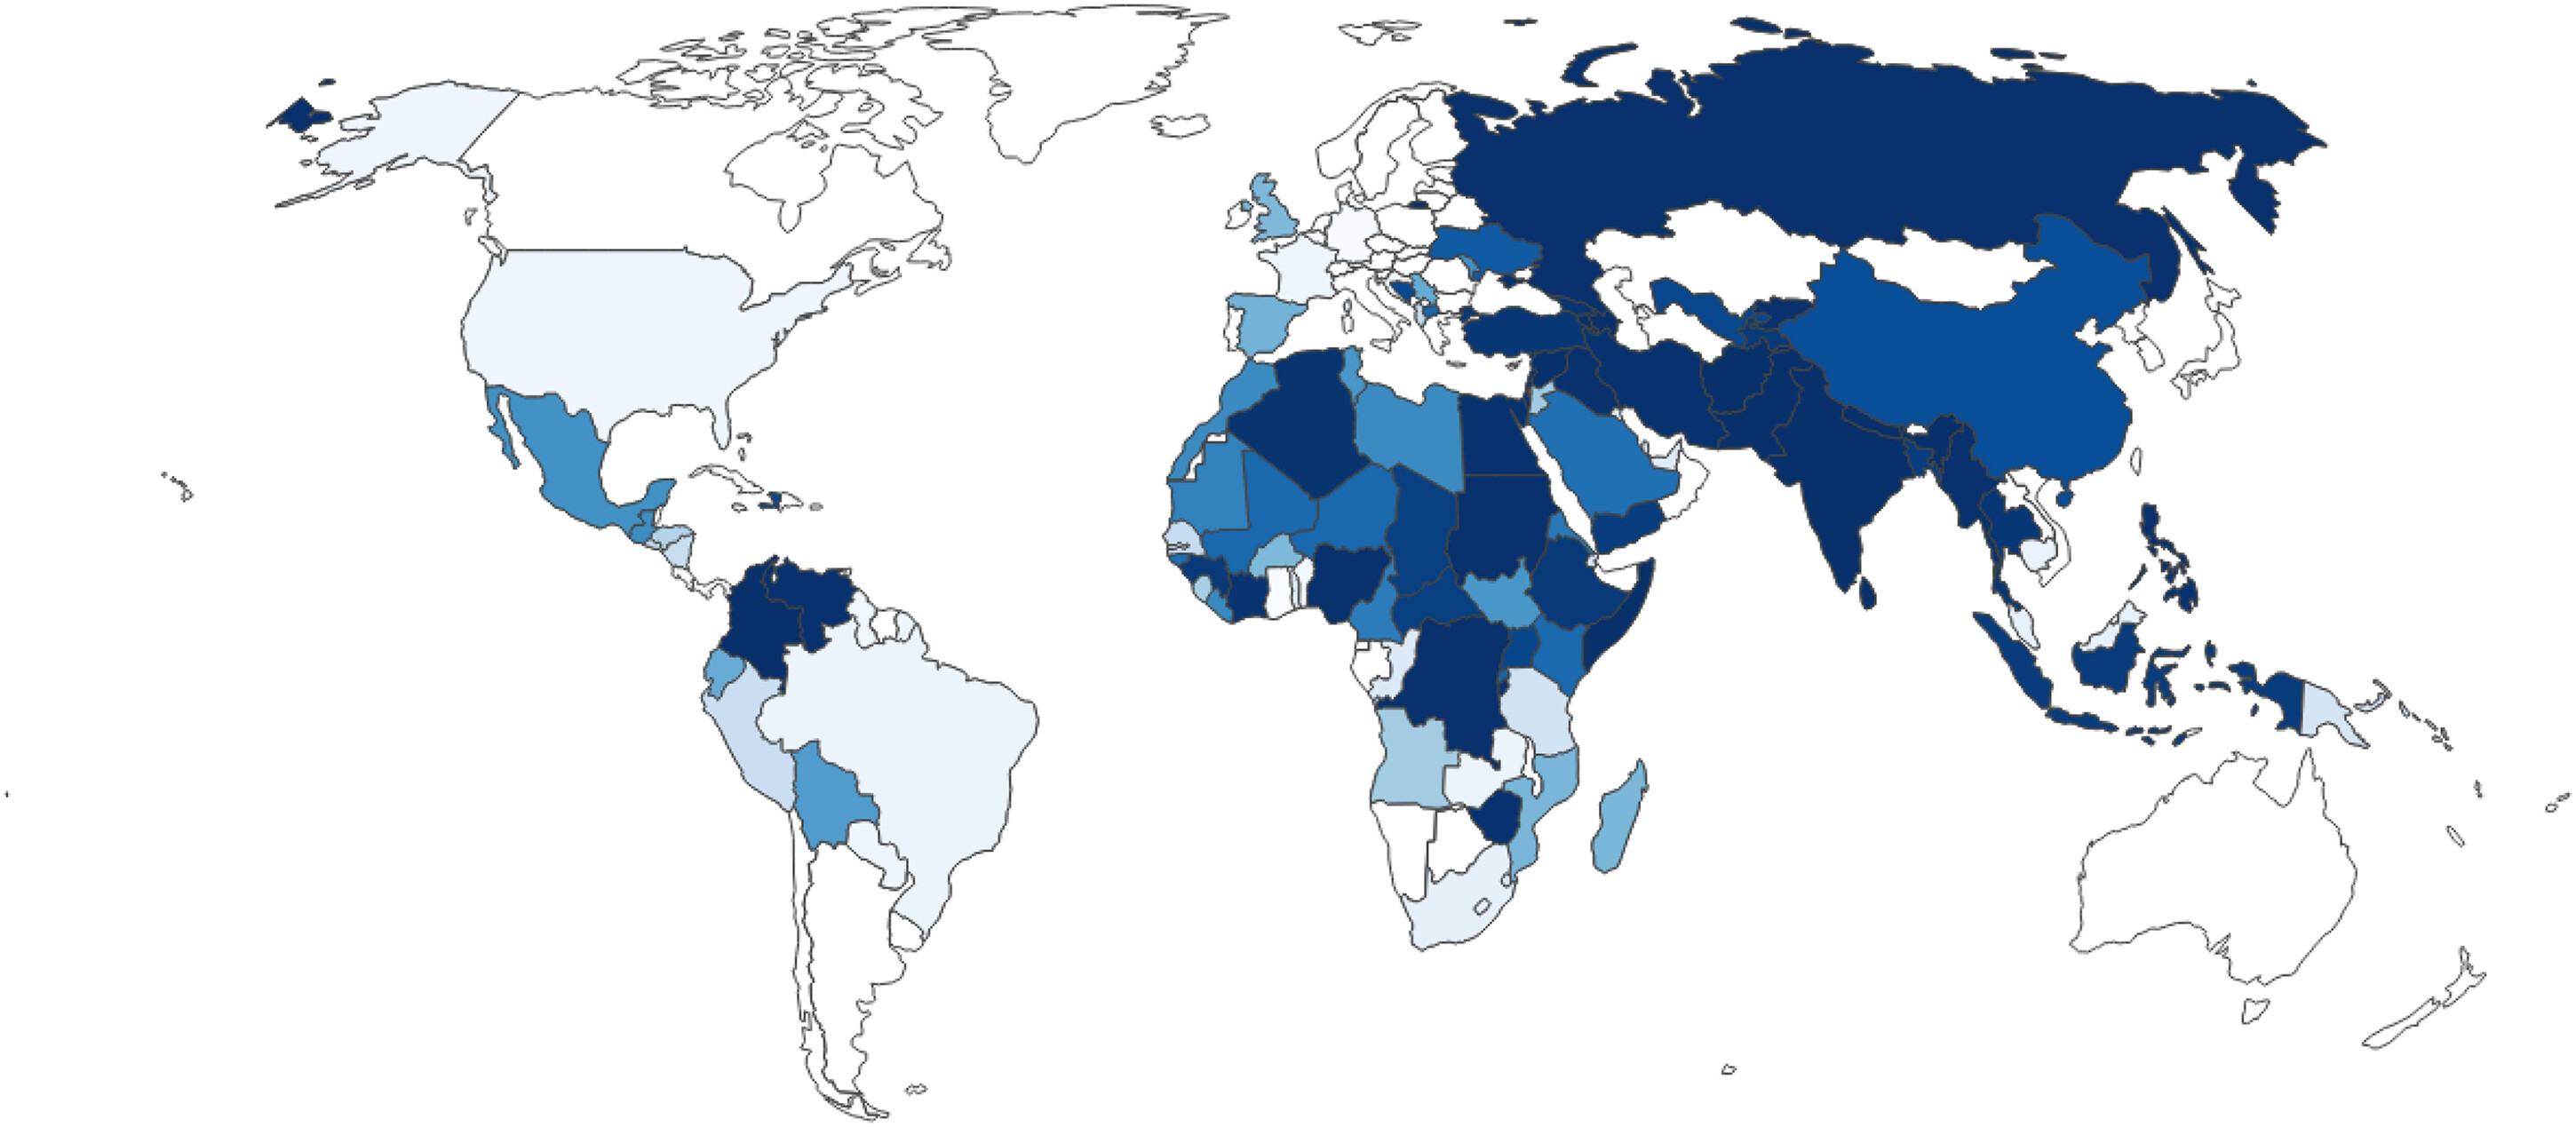
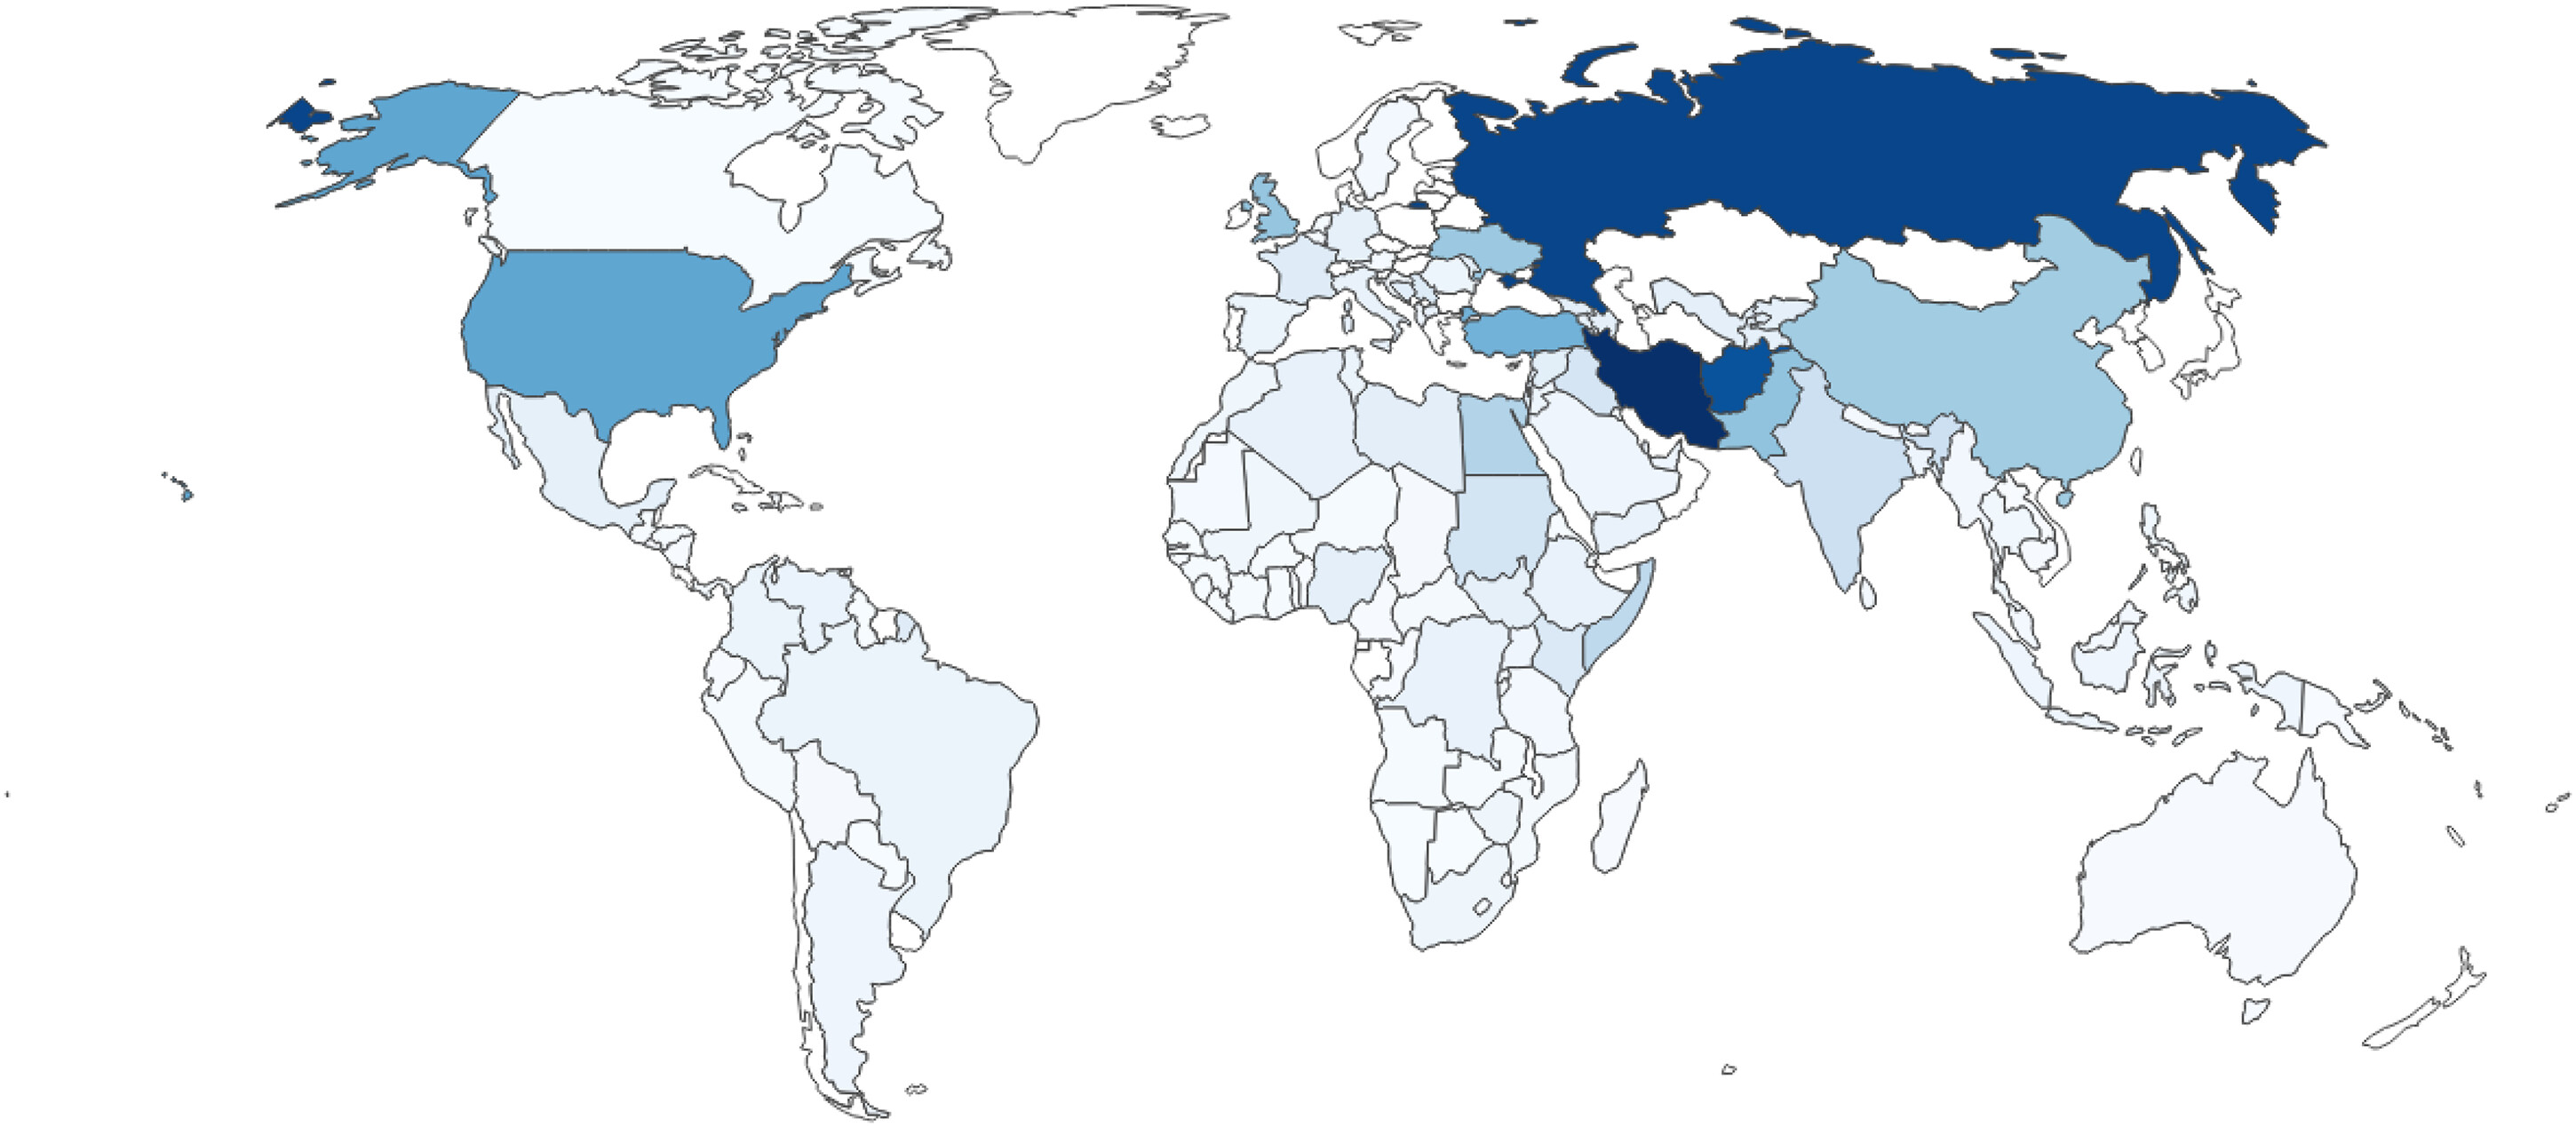
Figure 1 and
2 show the coverage and the relative frequency of countries in the CW and the BBC corpus respectively.
17Darker blue indicates a higher share of reports concerning a country and lighter blue tones show a lower share. While the CW corpus shows a more equal distribution in the number of countries covered by reports, the BBC corpus shows a different picture: A large majority of reports concern Iran (9.6%), Russia (8.9%) and Afghanistan (8.3%). Although CrisisWatch also focuses more on countries with conflict-related events, the reporting is not dominated by a few countries. The last difference is the different styles and contents of the texts. While the CW reports are short, technical and rather “choppy” descriptions of conflict events, the BBC articles are newspaper articles and therefore less technical with more emphasis on readability and flow of language. Examples for a CW report can be found in the Supplementary Material; however, sharing BBC Monitoring newspaper articles is not possible for proprietary reasons.
18 I am interested in investigating which kind of text data can add more value to a prediction task and whether it is necessary to construct large resource-intense newspaper corpora for conflict prediction.
Tables 2 and
3 show the summary statistics for the textual features and the target variable, UCDP GED fatalities, for the BBC and the CW corpus respectively. The textual features from the dictionaries include negative and positive values while the BERT and Wordscores features are strictly positive as they were trained to mimic the characteristics of fatalities.
Model results
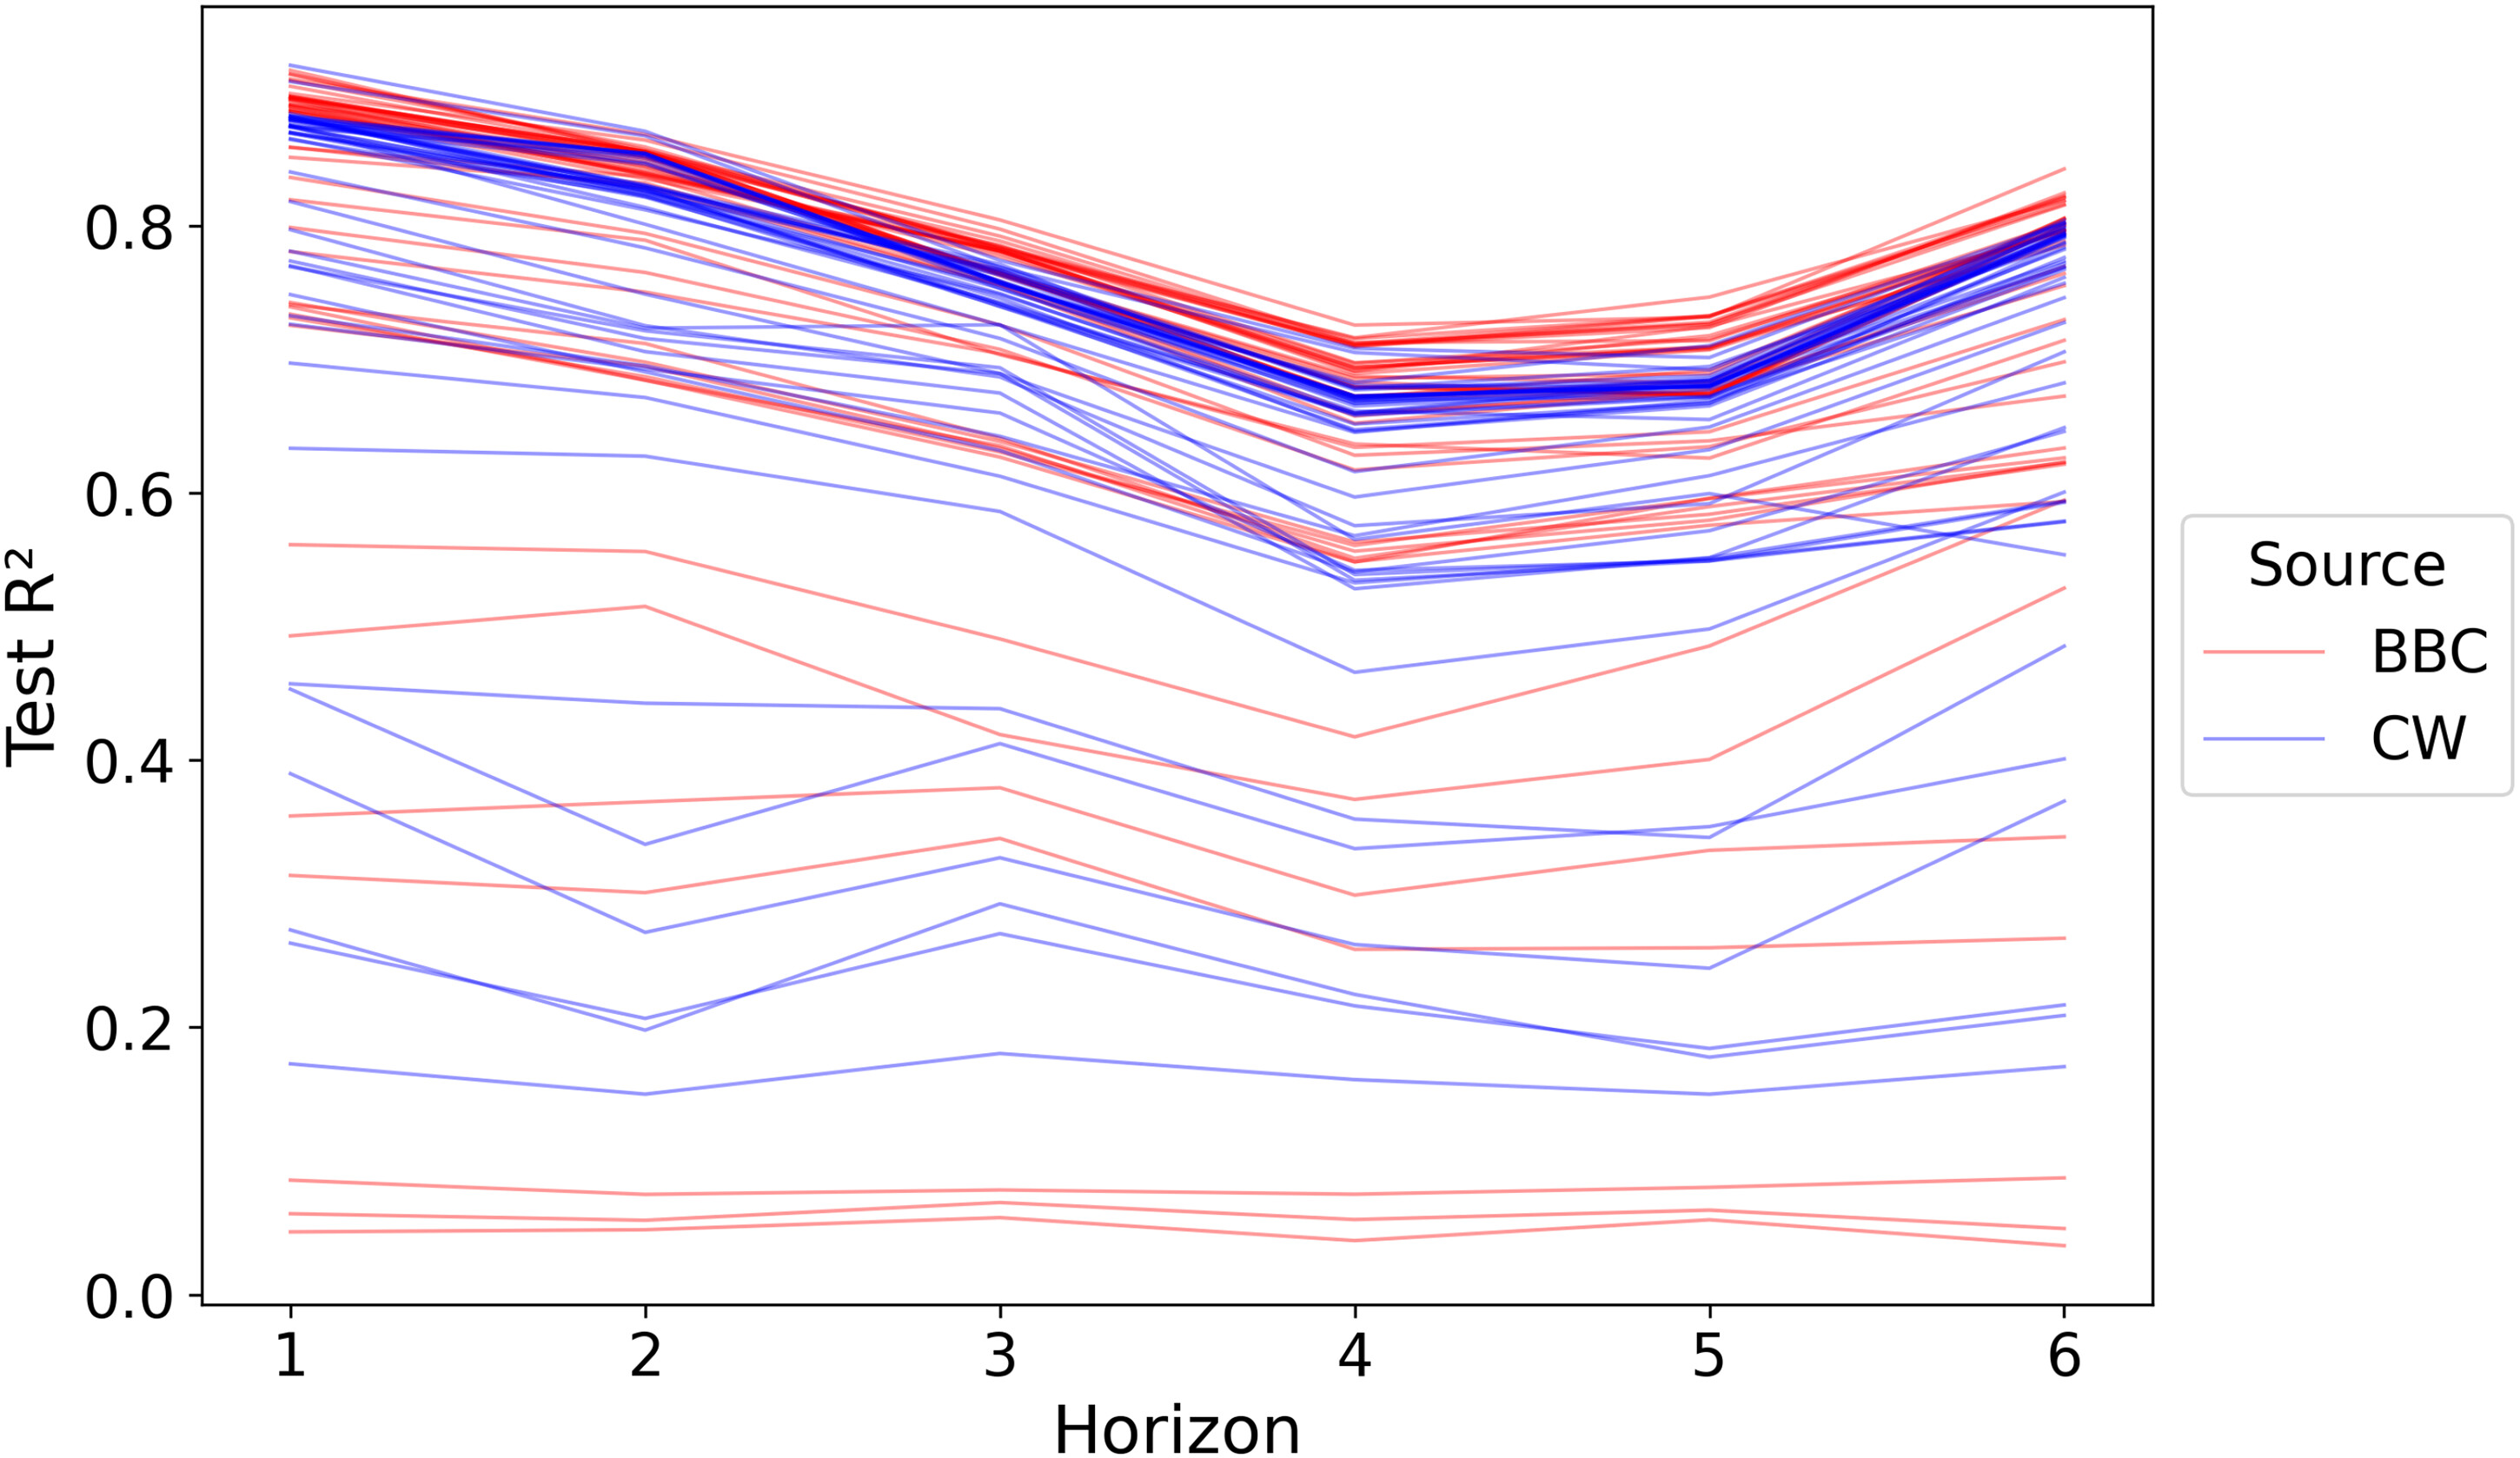
Figure 3 gives a general overview of the performance of all 468 models separated by which text corpus is being used. As can be seen in the figure, the performance of models varies vastly. However, two general trends can be identified: first, despite the shorter training window, owing to the limited availability of articles, BBC models tend to perform slightly better. BBC models achieve the highest overall
R2 for each timestep; however, some of the BBC models are also among the worst models. Second, predicting further into the future is more difficult than predicting the next month. The better performance of models for
t + 6 is not a general trend but a result of
t + 4 and
t + 5 being more violent months and hence more difficult to predict.
19 However, which groups of models tend to perform better and which text features add the most are more important questions. To answer them, I first have to establish the baselines with which the text features can be compared.
Figure 4 (left) shows the performance of the two baseline model categories, Conflict Trend and the Structural model, in addition to all text features for both text corpora. As both baseline models include the lagged target variable, I expect them to achieve good performance metrics. Indeed, it can be seen that the two baseline models outperform all of the text features with
R2 ' between 0.8 and 0.9. Although both models achieve very similar performance metrics, the Structural model outperforms the Conflict Trend model over all time steps in the BBC data. Interestingly, for the CW data, Conflict Trends only outperforms the Structural model in
t + 2.
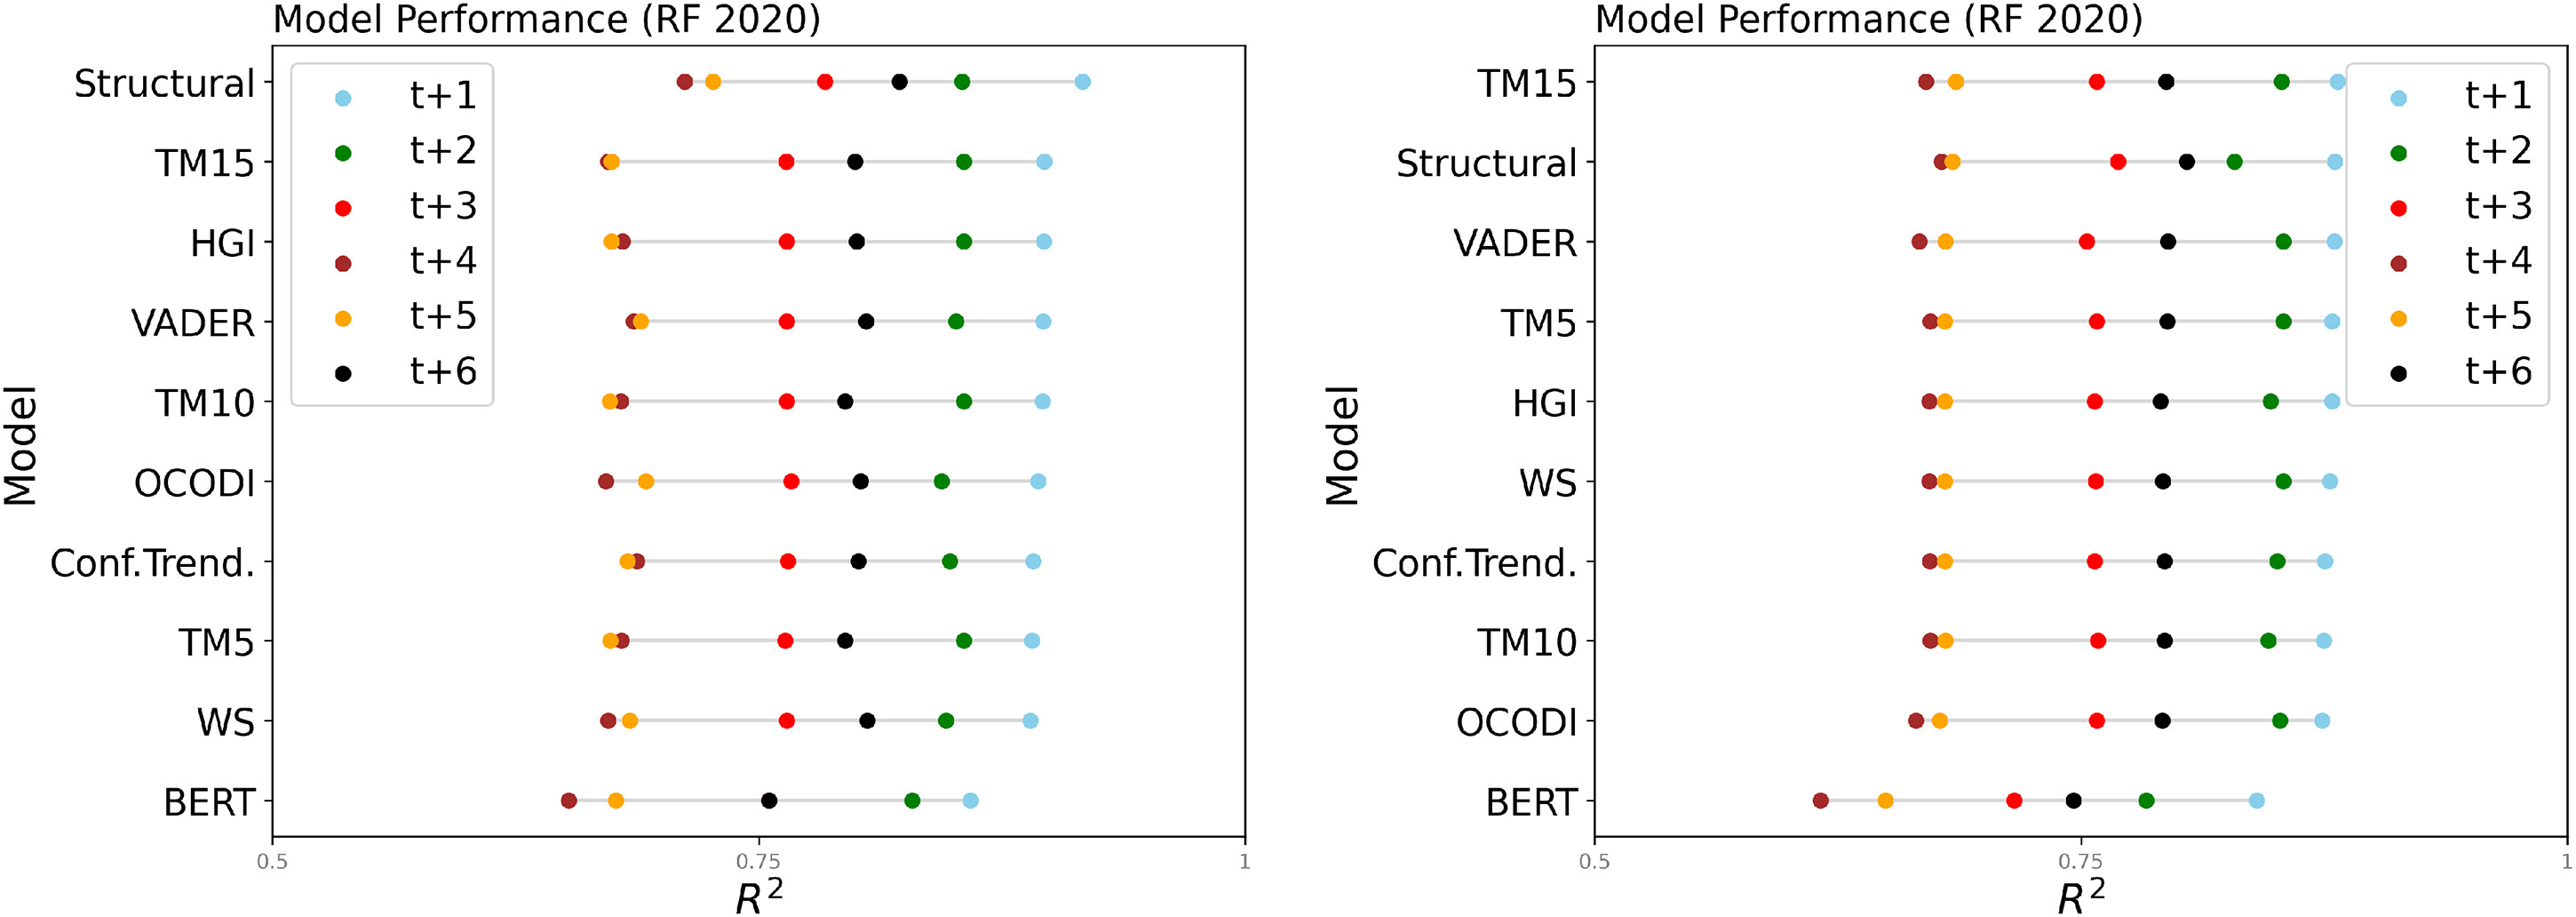
After establishing the baselines, I can now turn to the performance of the text features. In
Figure 4, in addition to the two baselines, I see the performance of models using only the different text features. As standalone features, no text feature can beat the baseline models; however, this was expected. Among all text features, it is not surprising that a transformer-based model achieves the best performance with an
R2 close to 0.8. It is impressive to achieve such a performance only on information contained in texts. Nonetheless, all features from NLP methods that are directly linked to the target variable (BERT, OCODI, Wordscores) reach acceptable levels of
R2. Features that are not directly linked to the target, general-purpose dictionaries, and topic models (TM15),
20 achieve a considerably lower performance. For the Vader and HGI dictionaries, this comes as less of a surprise but given the good performance of topic models shown by
Mueller and Rauh (2022), these results are unexpected.
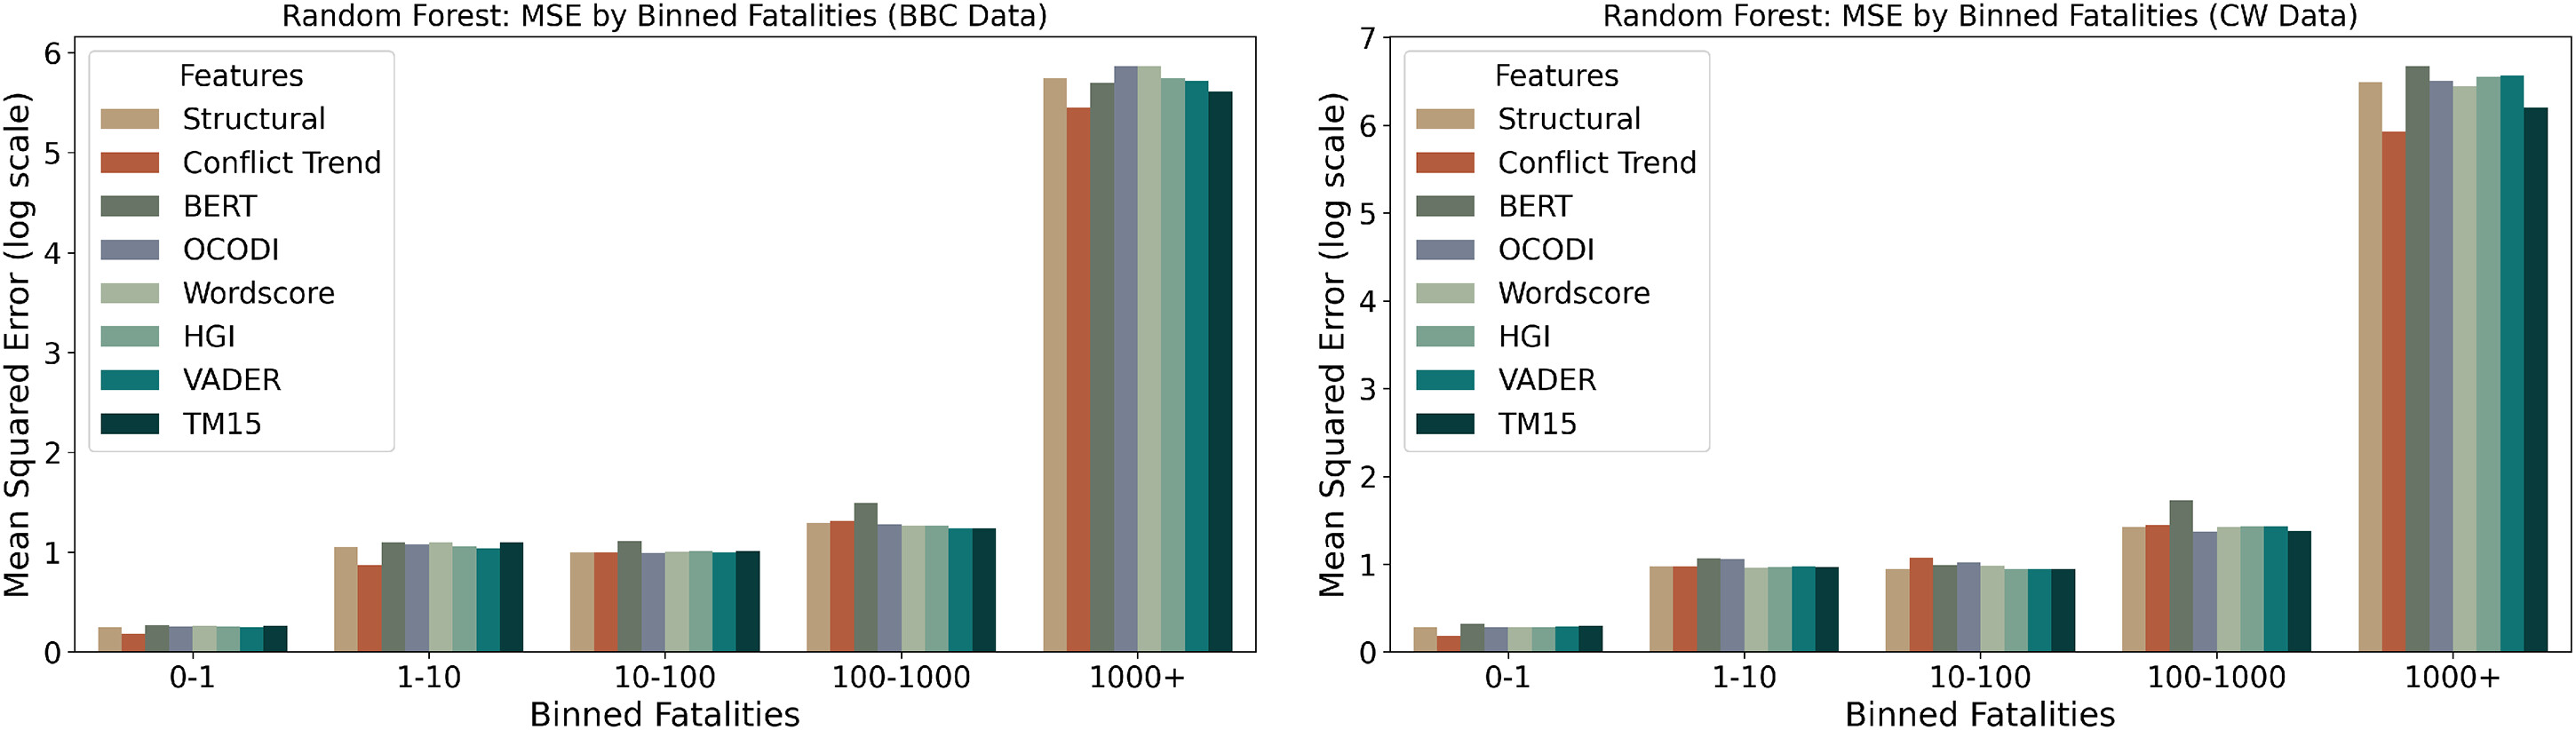
Next, I compare how these models perform across the distribution of fatalities.
Figure 5 shows the model performance for each of these models across different bins of the outcome variable.
Across both datasets, a clear trend emerges of the MSE increasing substantially with higher fatality bins, reflecting the greater difficulty of accurately predicting large-scale events. For both datasets, models based on structural features and conflict trends are often exhibiting the lowest MSE across most bins, particularly in the lower and intermediate fatality ranges. Somewhat surprisingly, models relying on textual features do not display markedly higher errors, with maybe the exception of BERT, which has slightly higher errors in the middle three bins. This holds true across datasets and even in the highest fatality bin (1000+).
21 Notably, the relative performance of models remains stable between the two datasets, although overall MSE values are somewhat higher in the BBC data. These results suggest that there is not a huge difference between models, even for rare, high-severity events.
Since the goal of this paper is to improve our understanding of how text features can complement traditional conflict prediction models, next I investigate which NLP approach adds the most to the baseline models. In
Figure 6 we can see the results when combining each of the text features with the conflict trends variables. As a reference, the figures also include the results for the conflict trends and the structural models. For both datasets, the results are very similar and it becomes apparent that text features are no silver bullet. The differences in performance are marginal. Simply adding text features to prediction models does not significantly improve their predictive performance. Although most text features increase the performance in comparison with the Conflict Trend baseline model, the Structural model outperforms all models on the BBC data and is only slightly beaten by the TM15 model in the CW data. However, again, the differences in performance are marginal. Interestingly, the text features that did not perform well as standalone features (Topic models, general-purpose dictionaries, and Wordscore), better complement the baseline models. It comes as a surprise that BERT is the only text feature that does not seem to complement existing approaches well. Although BERT is the best (standalone) text feature, it does not improve the baseline models. This may be because BERT can capture conflict trends reasonably well only from texts, but cannot help explain additional variability beyond that. Unsupervised or general-purpose approaches seem to capture latent information that is not directly correlated with conflict trends but can add to conflict history.
In the Online Appendix, I provide tables that display the R2 (and MSE) for all models over the whole forecast horizon for both the Random Forest as well as the XGBoost models. These results warrant a discussion of the tradeoff between performance gains and computational costs. Some text processing techniques are more computationally expensive than others. In particular, transformer models require sophisticated IT infrastructure, while applying off-the-shelf dictionaries is comparatively inexpensive. While the high computational cost for transformer models seems worth the gains in performance when there are no other features available, the performance drop-off when using them to complement other features suggests focusing on computationally cheap methods, like sentiment dictionaries or Wordscores, when computational power is limited. Topic models, on the other hand, while also computationally expensive, particularly when implementing dynamic topic models as I do here, can complement the baseline models well and the increased computational cost seems to be warranted. While these considerations should not be the only factors guiding the choice of NLP approach, it is important to keep in mind that increased complexity and computational cost of a model does not necessarily translate to increased performance in all settings.
Overall, text features seem to capture ongoing conflict dynamics and appear to have the potential to complement traditional input features for prediction models. However, on a global level with conflict history available, I have shown that few features can supplement conflict trends as predictors. The results and the findings by
Mueller and Rauh (2022) point in the direction that text features could add more to predictions of conflict onset in cases where there is no conflict history (the so-called hard case problem) instead of global-level conflict intensity. Although further research is needed to systematically identify the conditions and cases in which text features can improve existing conflict prediction models, this paper is a first attempt to provide an overview of the potential benefits of using text features for crisis early warning models. Other interesting areas of further research might be to extend this evaluation to a more granular level, meaning to move beyond the country-month level. In general, it is advisable to use a high-quality newspaper corpus. The challenges associated with constructing such a newspaper corpus, however, are plenty, especially concerning country coverage and the challenge of constructing a diverse corpus consisting not only of articles from one international newspaper agency.