Search Strategy
We searched four databases, PubMed, PsycInfo, Web of Science, and ERIC (Educational Resources Information Center). The search strategy included a combination of keywords related to reading (reading, literacy, decoding, word recognition), ID (ID, mental retardation, mental deficiency, intellectual developmental disorder, developmental disability), and relation (relation, relationship, prediction, correlation, regression, association). A full description of the keywords for each database is in the
online supplements. No filters were used during the search. We performed several searches to ensure that articles published or made available since the first search were found and included in the final meta-analysis. The first search was conducted in August 2017, the second search in March 2021, and the third search in August 2022. The first search yielded 1,677 articles (1,333 after removing duplicates). For the subsequent searches, the same search strategy was adopted. One database had changed the interface of its advanced search; consequently, a minor change was made to the search strategy (see
online supplements). The second and third searches yielded 3,040 and 3,457 articles, respectively (1,202 and 387 articles, respectively, after removing duplicates within the searches and duplicates of those found in the previous searches).
In addition to the systematic search, other methods were used to find additional records. The first author sent inquiries for file drawer data to all 23 authors of already included articles who had valid email contact information in the publications, and 10 replied. Furthermore, the first author performed the following additional search methods: reference lists in all the included articles were scanned for suitable articles, articles citing the included articles were identified via Google Scholar and screened (completed in May 2021), and a request for file drawer data was made in a poster presentation at the 2019 Society for Scientific Studies of Reading conference.
Inclusion and Exclusion Criteria
For the abstract and full-text screening, the inclusion criteria were the presence of: (a) measures of decoding and/or reading comprehension; (b) correlational data; (c) a sample with a mean IQ at or below 70, and a maximum (i.e., range) IQ of 85 (any standardized assessment of cognitive ability was approved. Whenever multiple measurements were reported, the order of preference was non-verbal, full scale, and verbal); (d) a minimum sample size of 10 participants; and (e) participants with nonspecific ID (unknown etiology), Down syndrome, WS, or mixed etiology (i.e., participants with various aetiologies within the same sample). The most recent and current definitions of ID give much more emphasis to adaptive abilities (
APA, 2022); however, the most usual way to operationalize ID in research has been through a measure of IQ or related cognitive ability, as a result, our inclusion criteria reflected this approach. The meta-analysis included articles in dissertations, and all articles had to be written in English. Articles were excluded if the focus was another syndrome, another disability, if the participants also had autism, or if the article was a review. Data collection and reporting were guided by the directions of Preferred Reporting Items for Systematic Reviews and Meta-Analysis (PRISMA,
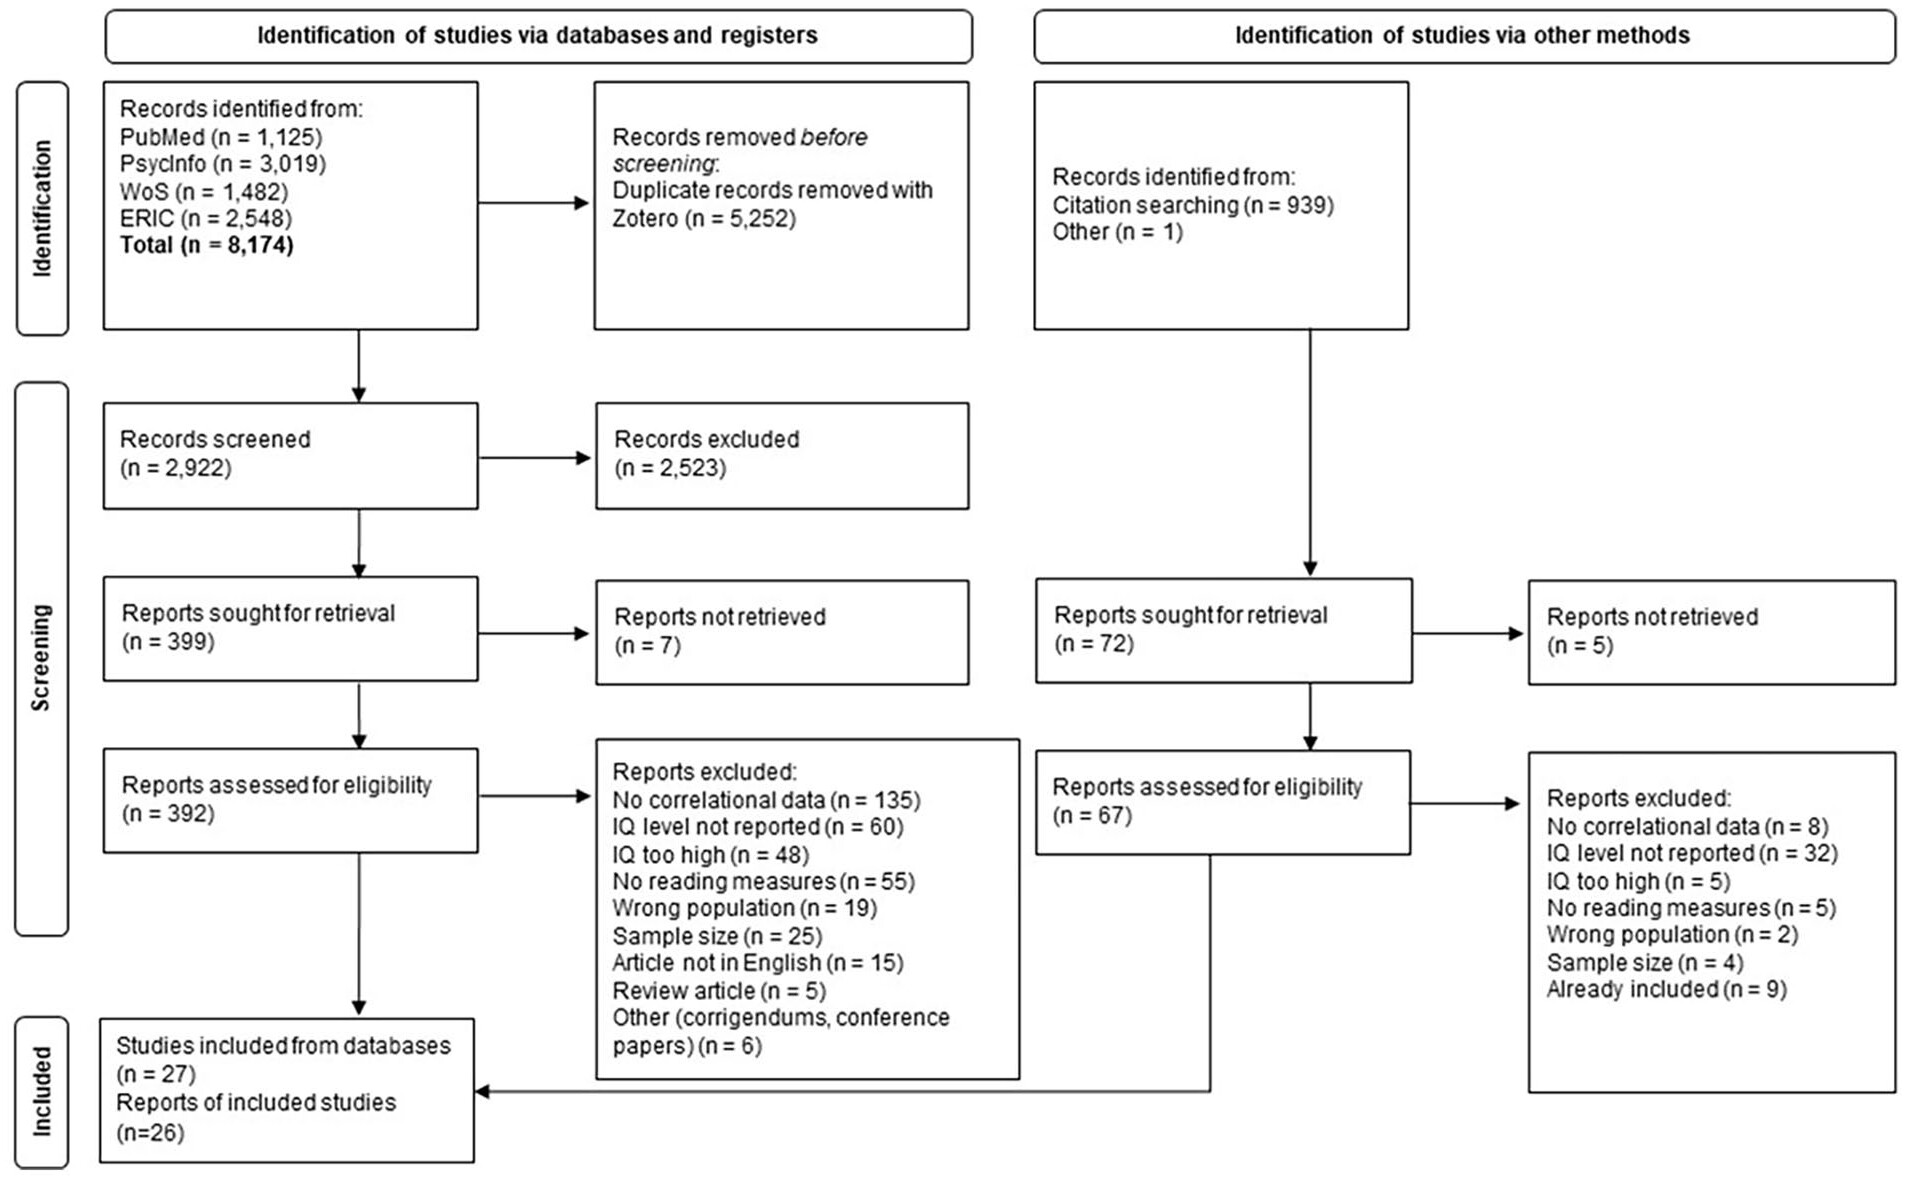
Page et al., 2021). For a more detailed description of identified records, of included and excluded records, and the reasons for exclusion, see
Figure 1. The PRISMA checklist and an abstract that adheres to the PRISMA guidelines are in the
online supplements.
Screening
Two of the authors screened the abstracts and full-text articles independently. After initial abstract screening, the following number of articles remained for full-text screening after each search: first search (
k = 166), second search (
k = 199), and third search (
k = 34). Inter-rater reliability figures were calculated for the abstract screening in the second and third search using Cohen’s
, and the agreement ranged between 0.56 and 0.70 which is considered as fair to good agreement according to
Fleiss et al. (2003). The percentage agreement ranged between 91% and 96%. The two authors marked each study as “include,” “exclude” or “unsure,” and only the studies marked with “exclude” from both authors were excluded before the next step. Studies marked as “unsure” and any studies where there was a difference between the two authors were discussed and resolved. The screening process was conducted in Zotero (first search) and Excel (second and third search). Through the systematic searches and the screening processes, we identified 24 articles that met our inclusion criteria. In addition, the inquiries for file drawer data and forward and backward citation searches made by the first author yielded one additional article plus one additional data set, which was later published. Hence, a total of 26 articles were identified and included in the meta-analysis. In addition, the study by
Levy (2011) involves two independent samples, one with DS and one with nonspecific ID. These samples are reported separately in the primary study and thus treated as two separate studies in this meta-analysis, meaning that the final set consists of 27 studies.
Coding
Two of the authors coded the descriptive data and the correlations. Agreement between coders was 93% for the descriptive data and 96% for the correlations. All disagreements were discussed and resolved. The articles in this meta-analysis were mainly cross-sectional studies. There also were some relevant longitudinal studies (k = 3) and for these, the pre-test data was used. Our meta-analysis targeted variables that have been found to correlate with reading comprehension and decoding in research on individuals with ID and with typical development. Hence, we coded all pairwise correlations between the following variables: reading comprehension, decoding, phonological awareness, listening comprehension, vocabulary, phonological STM, visual STM, executive-loaded working memory (ELWM), RAN, IQ, chronological age, letter-sound knowledge, and grammatical comprehension. The mean age reported in the primary studies was coded in months, and when age was reported in years in the primary study it was converted to months by the coding author.
Data Analysis
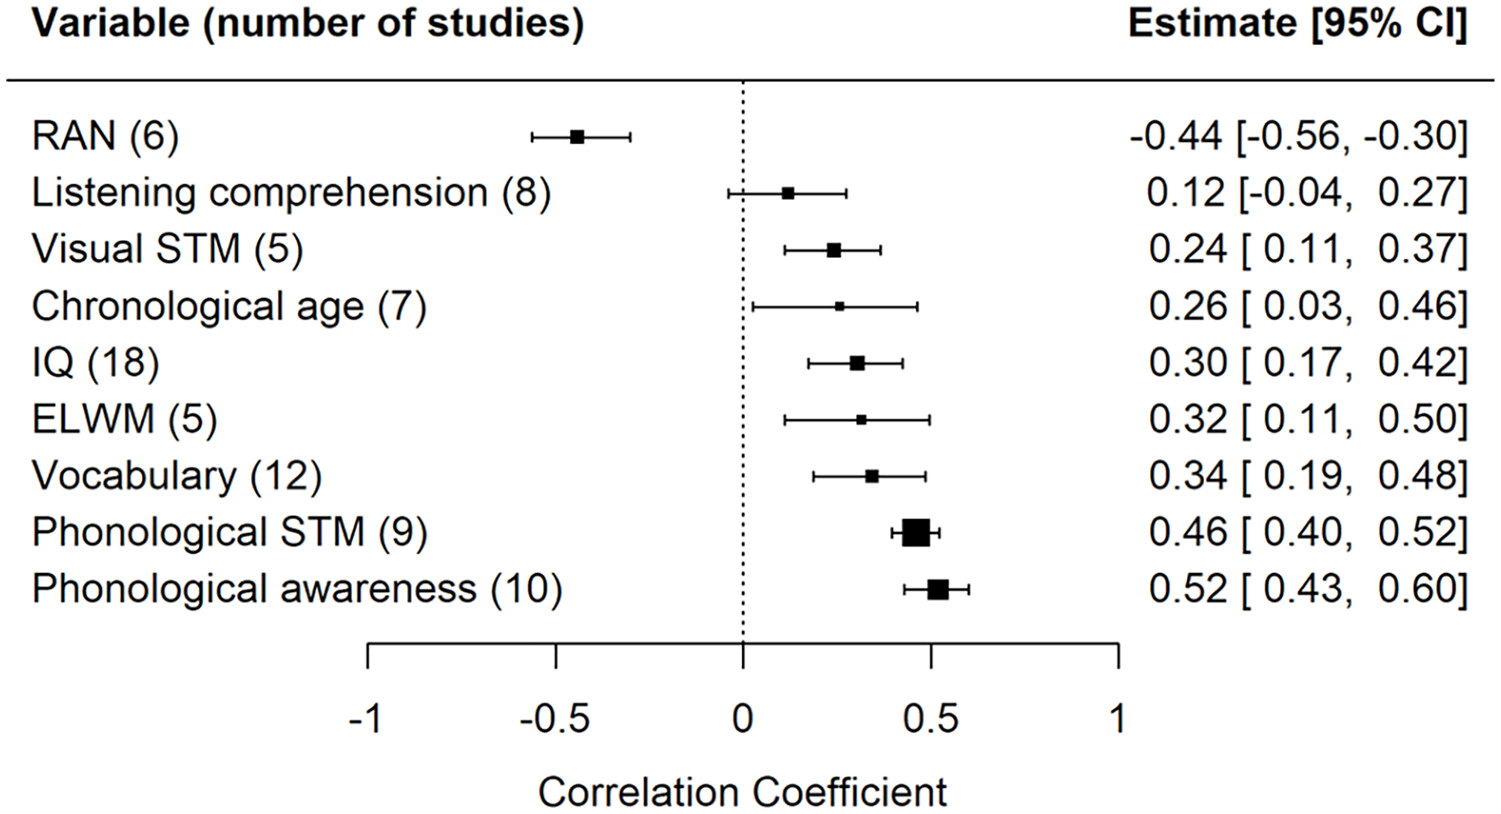
The number of relevant variables varied across the primary studies. Hence, some of the coded correlations were reported in many of the primary studies, whereas some correlations only occurred in one or two primary studies. To minimize the risk of bias where the result is driven by a few primary studies, we decided to only analyze correlations between variables that were reported in five or more studies. As a result, our meta-analysis included correlations between decoding and these variables: phonological awareness, listening comprehension, vocabulary, phonological STM, visual STM, ELWM, RAN, IQ, and chronological age and between reading comprehension and these variables: decoding, listening comprehension, vocabulary, and IQ.
All analyses were made using R (R Core Team, 2017), and the following R packages: metafor (
Viechtbauer, 2010), tidyverse (
Wickham, 2017), readxl (
Wickham & Bryan, 2019), knitr (
Xie, 2015), dplyr (
Wickham et al., 2019), and robvis (
McGuinness, 2019). The manuscript was formatted using papaja (
Aust & Barth, 2017), and citr (
Aust, 2016). The effect size of interest in this meta-analysis was the correlation coefficient
r. Effect sizes were calculated using the escalc() function in the metafor package based on the studies’ reported correlation coefficients and sample sizes. As recommended in the metafor package, the correlations were transformed to
z-scores using Fisher’s
r-to-
z transformation to reduce bias, and these scores were then used in the analyses. In a meta-analysis, a fixed-effects model or random-effects model could be used. A fixed-effects model assumes that there is one underlying effect that is the same for all studies. A random-effects model assumes that the effect could be different in each study, depending on, for example, participant characteristics (different mean IQ in different studies) or design of the studies. For the current meta-analysis, it was reasonable to assume that the underlying effect could be different across studies and, therefore, we used a random-effects model for the analyses. In some cases, primary studies used multiple measures for the same variable (e.g., subtests of phonological awareness such as blending and elision). These effect size estimates could not be assumed to be independent and to deal with the dependencies we used a robust variance estimation (
Pustejovsky & Tipton, 2022) for the affected correlations. The random-effects model was fitted on the
z-transformed data, and the effect sizes were then back-transformed to correlations for easier interpretation of results.
To test the degree of heterogeneity between studies we used three different heterogeneity measures. Cochran’s
Q-test was conducted to examine whether heterogeneity was different from zero. As this test is sensitive to the number of studies included, the
I2-statistic was used to determine the proportion of observed variance reflecting true variation between effect sizes (
Higgins et al., 2003). We used the categorization proposed by
Higgins et al. (2003), namely that
I2 values of 25%, 50%, and 75% are regarded as low, moderate, and high, respectively. Finally, the amount of between-study heterogeneity (
) was estimated using the restricted maximum-likelihood estimator (
Viechtbauer, 2005). We used the same rule as implemented by
Hjetland et al. (2020), namely that a
larger than 0.1 indicates a large variation between studies. To assess whether study quality could explain heterogeneity in the results, we calculated an overall study quality indicator for each study. We did this by assigning different scores to the three risk of bias levels, where low risk of bias gave 2 points, some concerns (or not reported) gave 1 point, and high risk of bias gave 0 points. Study quality was used as a moderator in the analyses that included at least 10 primary studies, because performing moderator analyses on smaller samples can introduce other problems (
Higgins et al., 2019). Publication bias was tested using two methods, namely funnel plots and the Rank Correlation test examining Kendall’s
. Publication bias is indicated through asymmetrical funnel plots and a significant Rank Correlation test. We used Cook’s distances to identify studies that were likely to be influential in the context of the model (
Viechtbauer & Cheung, 2010). Studies with Cook’s distance larger than the median plus six times the interquartile range of Cook’s distances were considered to be influential.
The Grading of Recommendations Assessment, Development, and Evaluation (GRADE) tool (
Balshem et al., 2011) is a valuable assessment of the certainty of intervention effects; because our meta-analysis concerns correlations, we used a modified version of GRADE to obtain measures of certainty (see
Yousefifard & Shafiee, 2023 for a discussion on this topic). This involved four different indicators: (a) an overall assessment of risk of bias, (b) inconsistency of results (a confidence interval [CI] larger than 0.3), (c) imprecision of results (an
I2 larger than 50%), and (d) a significant publication bias test.