

Principals’ Special Education Experience: Implications for Special Education Teacher Turnover
Abstract
Introduction
Literature Review
Special Education Teachers and Turnover
Special Education Teacher Working Conditions and Principal Leadership
Methods
Sample
| (1) | (2) | (3) | (4) | |
|---|---|---|---|---|
| Principal and Teacher Panels | Total | Principals without SpecEd teaching experience | Principals with SpecEd teaching experience | p-value for difference using t-test |
| Panel A. Principal | ||||
| Num. of principal-year obs | 67,965 | 52,990 | 14,975 | |
| Total experience (years) | 17.15 | 17.20 | 16.98 | 0.00 |
| Principal experience (years) | 3.85 | 3.91 | 3.64 | 0.00 |
| Female (percent) | 66.30 | 68.03 | 60.17 | 0.00 |
| Principal race/ethnicity (percent) | ||||
| Asian | 0.70 | 0.65 | 0.87 | 0.00 |
| Black/Af.Am. | 13.75 | 13.58 | 14.32 | 0.02 |
| Latinx/Hisp. | 24.44 | 26.67 | 16.53 | 0.00 |
| White | 58.96 | 56.86 | 66.40 | 0.00 |
| Other | 2.15 | 2.23 | 1.88 | 0.01 |
| Panel B. Special Education Teacher | ||||
| Num. of teacher-year obs | 407,480 | 308,716 | 98,764 | |
| Total experience (years) | 10.99 | 11.02 | 10.94 | 0.02 |
| Female (percent) | 76.16 | 76.78 | 74.23 | 0.00 |
| Retention rate (percent) | 73.15 | 73.05 | 73.45 | 0.01 |
| Teacher race/ethnicity (percent) | ||||
| Asian | 1.58 | 1.57 | 1.61 | 0.35 |
| Black/Af.Am. | 13.45 | 13.44 | 13.46 | 0.84 |
| Latinx/Hisp. | 19.49 | 20.39 | 16.69 | 0.00 |
| White | 62.95 | 62.08 | 65.65 | 0.00 |
| Other | 2.53 | 2.52 | 2.59 | 0.30 |
| Panel C. General Education Teacher | ||||
| Num. of teacher-year obs | 2,539,995 | 2,007,449 | 532,546 | |
| Total experience (years) | 10.98 | 10.94 | 11.14 | 0.00 |
| Female (percent) | 75.85 | 76.52 | 73.32 | 0.00 |
| Retention rate (percent) | 76.21 | 76.37 | 75.59 | 0.00 |
| Teacher race/ethnicity (percent) | ||||
| Asian | 1.61 | 1.60 | 1.64 | 0.04 |
| Black/Af.Am. | 10.14 | 10.15 | 10.10 | 0.28 |
| Latinx/Hisp. | 27.54 | 28.72 | 23.11 | 0.00 |
| White | 58.21 | 57.02 | 62.69 | 0.00 |
| Other | 2.50 | 2.51 | 2.46 | 0.02 |
Measures
Special Education Teacher Status
Principal Special Education Experience
Timing of New Principal
School Characteristics
Analytical Strategy
Results
Descriptive Results

| (1) | (2) | (3) | (4) | (5) | |
|---|---|---|---|---|---|
| District Type/ School level | Number of School-year observations | % of Principals with Special Education Teaching Experience | Special Education Teacher Retention Rate (percent) | General Education Teacher Retention Rate (percent) | p-value for difference using t-test |
| Urban | 26,273 | 18.92 | 73.21 | 76.11 | 0.00 |
| Elementary | 13,292 | 15.46 | 72.32 | 77.29 | 0.00 |
| Middle | 4,116 | 21.96 | 72.73 | 75.28 | 0.00 |
| High | 3,303 | 24.70 | 76.95 | 78.73 | 0.00 |
| Elementary & Middle | 3,145 | 18.25 | 70.08 | 72.20 | 0.00 |
| Middle & High | 1,115 | 25.11 | 63.93 | 68.88 | 0.00 |
| K-12 | 1,302 | 26.27 | 68.19 | 63.44 | 0.00 |
| Suburban | 17,557 | 20.43 | 73.84 | 76.82 | 0.00 |
| Elementary | 9,560 | 16.30 | 71.47 | 78.32 | 0.00 |
| Middle | 3,246 | 24.89 | 73.94 | 75.56 | 0.00 |
| High | 2,408 | 27.53 | 77.14 | 77.19 | 0.82 |
| Elementary & Middle | 1,230 | 22.44 | 73.06 | 76.09 | 0.00 |
| Middle & High | 363 | 28.10 | 74.60 | 71.36 | 0.01 |
| K-12 | 750 | 24.00 | 68.63 | 61.34 | 0.00 |
| Town | 8,402 | 25.01 | 71.65 | 75.07 | 0.00 |
| Elementary | 3,728 | 21.75 | 69.10 | 76.41 | 0.02 |
| Middle | 1,671 | 26.15 | 70.38 | 71.62 | 0.00 |
| High | 1,846 | 30.17 | 74.96 | 76.12 | 0.00 |
| Elementary & Middle | 776 | 21.78 | 70.99 | 75.46 | 0.00 |
| Middle & High | 206 | 31.07 | 76.31 | 68.30 | 0.00 |
| K-12 | 175 | 36.00 | 70.18 | 69.40 | 0.76 |
| Rural | 15,733 | 27.43 | 72.41 | 76.02 | 0.00 |
| Elementary | 5,267 | 20.03 | 71.45 | 78.64 | 0.00 |
| Middle | 2,678 | 26.33 | 70.50 | 71.80 | 0.00 |
| High | 2,832 | 33.83 | 74.82 | 76.13 | 0.00 |
| Elementary & Middle | 1,685 | 26.29 | 71.30 | 75.02 | 0.00 |
| Middle & High | 1,049 | 32.41 | 72.60 | 73.03 | 0.64 |
| K-12 | 2,222 | 36.68 | 73.19 | 76.36 | 0.00 |
Regression Analysis
| (1) | (2) | (3) | (4) | (5) | (6) | (7) | |
|---|---|---|---|---|---|---|---|
| Variables | Teacher Retention | ||||||
| Panel A: Special Education Teacher Retention | |||||||
| Principal SpecEd Experience | 0.0056* | 0.0079** | 0.0062** | 0.0063** | 0.0060** | 0.0054** | 0.0024 |
| (0.0030) | (0.0029) | (0.0027) | (0.0026) | (0.0025) | (0.0023) | (0.0032) | |
| Observations | 407,480 | 407,480 | 407,480 | 407,480 | 407,480 | 407,459 | 407,262 |
| R-squared | 0.0031 | 0.0047 | 0.0084 | 0.0173 | 0.0191 | 0.0349 | 0.0640 |
| Panel B: General Education Teacher Retention | |||||||
| Principal SpecEd Experience | -0.0066** | -0.0026 | 0.0007 | 0.0003 | 0.0002 | 0.0007 | 0.0015 |
| (0.0026) | (0.0025) | (0.0022) | (0.0021) | (0.0020) | (0.0017) | (0.0020) | |
| Observations | 2,539,995 | 2,539,995 | 2,539,995 | 2,539,995 | 2,539,995 | 2,539,994 | 2,539,973 |
| R-squared | 0.0038 | 0.0073 | 0.0130 | 0.0256 | 0.0271 | 0.0399 | 0.0583 |
| Controls | |||||||
| Principal Characteristics | No | Yes | Yes | Yes | Yes | Yes | Yes |
| School Characteristics | No | No | Yes | Yes | Yes | Yes | Yes |
| Teacher Characteristics | No | No | No | Yes | Yes | Yes | Yes |
| Timing of New Principal | No | No | No | No | Yes | Yes | Yes |
| Fixed Effects | |||||||
| Year | Yes | Yes | Yes | Yes | Yes | Yes | Yes |
| District | No | No | No | No | No | Yes | No |
| School | No | No | No | No | No | No | Yes |
| (1) | (2) | (3) | (4) | (5) | (6) | (7) | |
|---|---|---|---|---|---|---|---|
| Variables | Teacher Retention | ||||||
| Special Education Teacher Retention | |||||||
| Principal SpecEd Experience | 0.0088** | 0.0111*** | 0.0085*** | 0.0083*** | 0.0077** | 0.0089*** | 0.0093** |
| (0.0038) | (0.0036) | (0.0033) | (0.0031) | (0.0031) | (0.0029) | (0.0044) | |
| Observations | 220,702 | 220,702 | 220,702 | 220,702 | 220,702 | 220,663 | 220,462 |
| R-squared | 0.0021 | 0.0038 | 0.0078 | 0.0162 | 0.0176 | 0.0356 | 0.0733 |
| Controls | |||||||
| Principal Characteristics | No | Yes | Yes | Yes | Yes | Yes | Yes |
| School Characteristics | No | No | Yes | Yes | Yes | Yes | Yes |
| Teacher Characteristics | No | No | No | Yes | Yes | Yes | Yes |
| Timing of New Principal | No | No | No | No | Yes | Yes | Yes |
| Fixed Effects | |||||||
| Year | Yes | Yes | Yes | Yes | Yes | Yes | Yes |
| District | No | No | No | No | No | Yes | No |
| School | No | No | No | No | No | No | Yes |
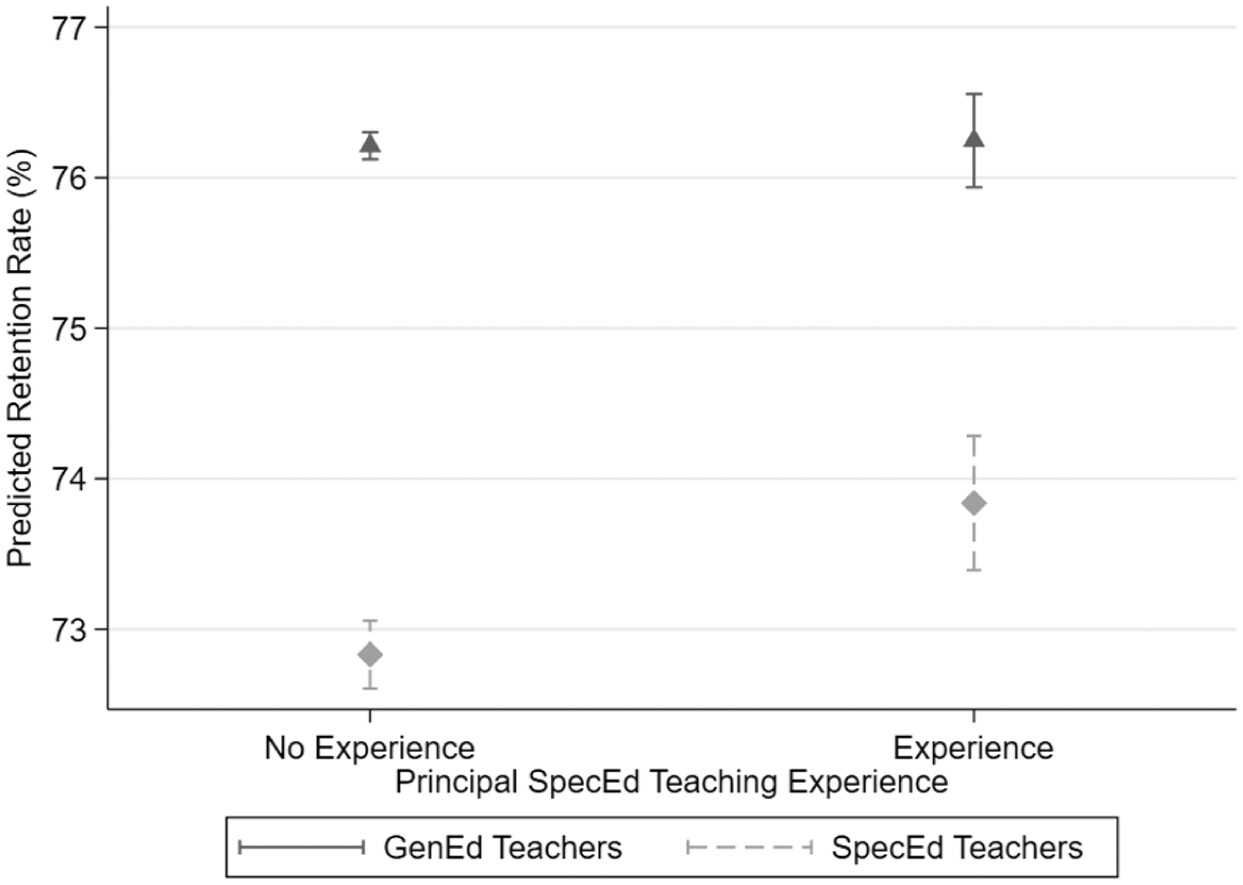
Interaction Analysis
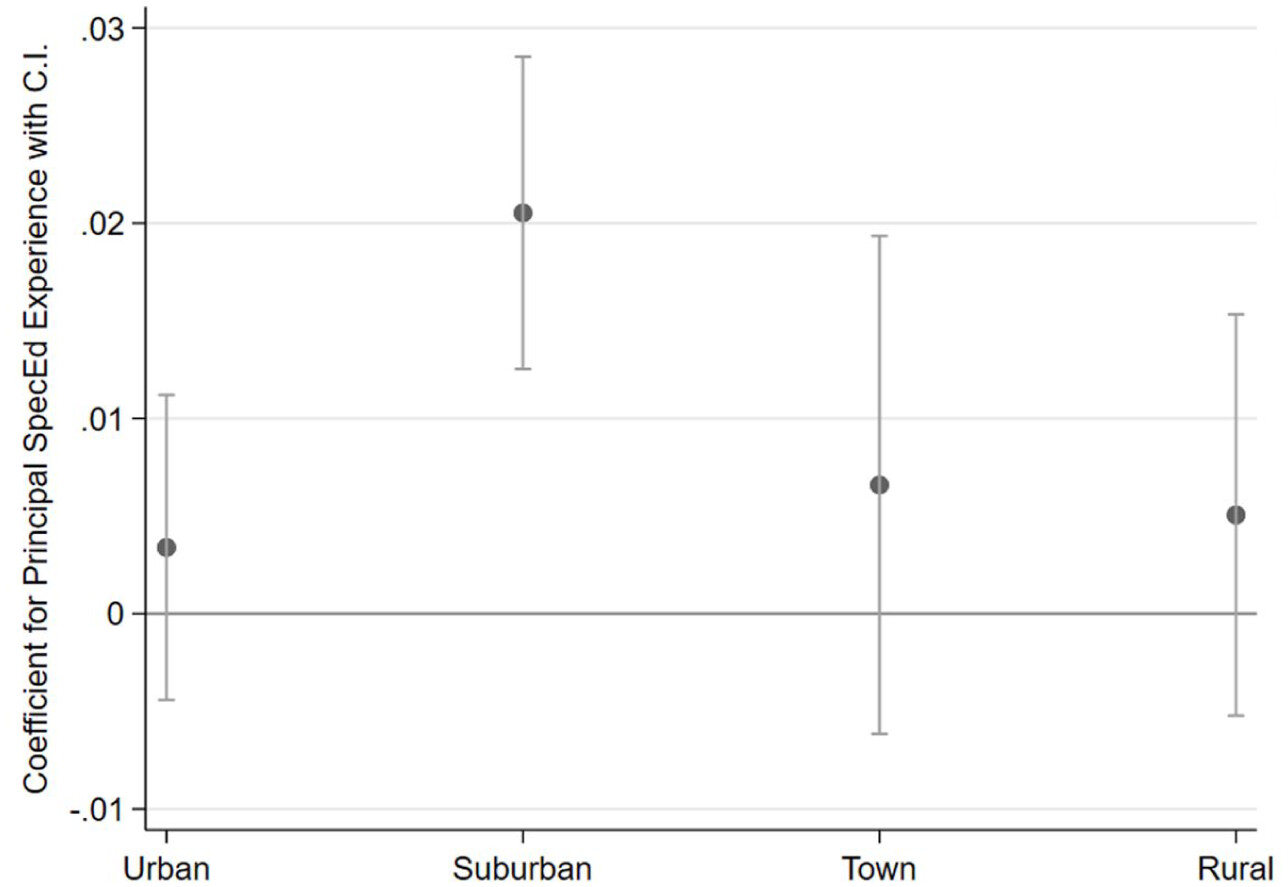

Additional Analyses: Variation by FTE Experience
| (1) | (2) | (3) | (4) | (5) | (6) | (7) | |
|---|---|---|---|---|---|---|---|
| Variables | Teacher Retention | ||||||
| Panel A: Special Education Teacher Retention | |||||||
| Principal SpecEd FTE: 0+ – 0.3 | -0.0047 | -0.0034 | -0.0043 | -0.0028 | -0.0020 | 0.0018 | -0.0019 |
| (0.0050) | (0.0049) | (0.0045) | (0.0043) | (0.0042) | (0.0039) | (0.0051) | |
| Principal SpecEd FTE: 0.3+ – 1 | 0.0126** | 0.0143*** | 0.0100** | 0.0105** | 0.0097** | 0.0099*** | 0.0084 |
| (0.0054) | (0.0050) | (0.0045) | (0.0043) | (0.0042) | (0.0036) | (0.0055) | |
| Principal SpecEd FTE: 1+ – 3 | 0.0033 | 0.0087 | 0.0070 | 0.0071 | 0.0077 | 0.0057 | 0.0065 |
| (0.0060) | (0.0060) | (0.0058) | (0.0055) | (0.0053) | (0.0048) | (0.0067) | |
| Principal SpecEd FTE: 3+ | 0.0107* | 0.0123** | 0.0122** | 0.0107** | 0.0093** | 0.0045 | -0.0016 |
| (0.0056) | (0.0054) | (0.0051) | (0.0049) | (0.0047) | (0.0043) | (0.0053) | |
| Observations | 407,480 | 407,480 | 407,480 | 407,480 | 407,480 | 407,459 | 407,262 |
| R-squared | 0.0032 | 0.0048 | 0.0085 | 0.0173 | 0.0191 | 0.0349 | 0.0640 |
| Controls | |||||||
| Principal Characteristics | No | Yes | Yes | Yes | Yes | Yes | Yes |
| School Characteristics | No | No | Yes | Yes | Yes | Yes | Yes |
| Teacher Characteristics | No | No | No | Yes | Yes | Yes | Yes |
| Timing of New Principal | No | No | No | No | Yes | Yes | Yes |
| Fixed Effects | |||||||
| Year | Yes | Yes | Yes | Yes | Yes | Yes | Yes |
| District | No | No | No | No | No | Yes | No |
| School | No | No | No | No | No | No | Yes |
Discussion
Conclusion
Declaration of Conflicting Interests
Funding
ORCID iDs
Footnotes
References
Biographies
Supplementary Material
Please find the following supplemental material available below.
For Open Access articles published under a Creative Commons License, all supplemental material carries the same license as the article it is associated with.
For non-Open Access articles published, all supplemental material carries a non-exclusive license, and permission requests for re-use of supplemental material or any part of supplemental material shall be sent directly to the copyright owner as specified in the copyright notice associated with the article.
Cite
Cite
Cite
Download to reference manager
If you have citation software installed, you can download citation data to the citation manager of your choice
Information, rights and permissions
Information
Published In

Keywords
Rights and permissions
Article versions
Authors
Metrics and citations
Metrics
Journals metrics
This article was published in Teacher Education and Special Education.
View All Journal MetricsPublication usage*
Total views and downloads: 924
*Publication usage tracking started in December 2016
Publications citing this one
Receive email alerts when this publication is cited
Web of Science: 0
Crossref:
There are no citing articles to show.
Figures and tables
Figures & Media
Tables
View Options
View options
PDF/EPUB
View PDF/EPUBAccess options
If you have access to journal content via a personal subscription, university, library, employer or society, select from the options below:
I am signed in as:
View my profileSign out

I can access personal subscriptions, purchases, paired institutional access and free tools such as favourite journals, email alerts and saved searches.
loading institutional access options
Alternatively, view purchase options below:
Purchase 24 hour online access to view and download content.
Access journal content via a DeepDyve subscription or find out more about this option.
