Intended for healthcare professionals
Available access
Research article
First published online August 1, 2022

A design optimization study of an air-cooling battery thermal management system for electric vehicles

Abstract

Air cooling is a highly cost-effective method for the battery thermal management systems due to its simple structure, high reliability and low maintenance cost. Different from other designs of only a single inlet/outlet structure in the literature, an air-cooling battery thermal management system with multiple inlets/outlets design was proposed in this paper. The effects of inlet/outlet positions and dimensions on the air-cooling battery thermal management system performance were thoroughly evaluated and compared. The optimal inlet/outlet position and dimension were identified based on the maximum battery temperature and the temperature uniformity in the air cooling field. The results showed that the symmetrical double inlets/outlets design (Design 4) delivered the top temperature uniformity with the lowest energy consumption. During 1C discharging at 2 m/s inlet airflow, the maximum temperature and temperature difference of the Design 4 were 1.01 K and 2.24 K lower than those of the basic Design 0 in addition to a pressure difference reduction of 7.85 Pa. Based on the optimal Design 4, 0.03 m outlet width could further reduce the maximum temperature and temperature difference by 0.47 K and 0.28 K than the worst 0.05 m design. Furthermore, 52 additional simulations under different operating conditions had proven that the superb cooling performance of the optimal design during mild discharging operations (0.5–1C).

Introduction

Global warming and environmental pollution are threatening people's lives and health conditions nowadays.1,2 In recent years, vehicle electrification is becoming more and more popular, being regarded as one of the most promising methods to relieve greenhouse gas emissions by eliminating the tailpipe CO2 emissions from conventional petrol or diesel internal combustion engine vehicles.3 By 2030, the global electric vehicle (EV) battery demands are predicted to reach over 1300 GWh, which is about 10 times higher than that in 2020.4 Lithium-ion (Li-ion) battery at present shows superiorities over other commercial batteries in terms of high-energy, high-power density, low self-discharge rate and almost zero memory effect. Its declining manufacturing cost boosts commercial EV development as a cost-effective foundation.5
For Li-ion battery cell selection, there is a trend to use larger volume battery cells to acquire both higher nominal capacity and specific energy, such as replacing the conventional 18650 cylindrical cells with 21700 or 4680 cells. For battery cooling methods, air cooling and liquid cooling are two principal cooling approaches used in EV battery thermal management systems (BTMSs). Supplementary Table 1 shows a comparison between two cooling methods. Generally, for mild operations of EVs such as short-distance driving or moderate charging and discharging, the air-cooling method is much favourable due to its advantages including simple structure, high reliability, as well as low manufacturing cost.6 The nominal capacity of 18650 cylindrical cells is around 1.5–3 Ah, which is lower than many other battery cell types such as prismatic and pouch cells. To deliver the same amount of energy, the 18650 battery pack needs more cells. Typically, an 85 kWh EV battery pack could contain more than 7104 pieces of 18650 cylindrical cells. Unavoidably, high cell number leads to a more complex battery pack structure, resulting in a significant challenge for an effective BTMS design. Due to the complex internal configuration, the prevalent cooling method for the 18650 EV battery pack is liquid cooling, which is a heavy and high-cost approach with a risk of coolant leakage. Theoretically, the total quantity of the battery cells could be reduced by more than 30% by substituting the 18650 cells with 21700 ones, leading to a greater expectation of cheaper and more reliable air-cooling BTMS. The application of larger cylindrical Li-ion battery cells is a very attractive topic for the purpose of EV cost reduction and performance improvement, but relevant studies about Li-ion 21700 cylindrical cells and their air-cooling BTMS designs are insufficient compared with those about the 18650 ones. To find the missing puzzle of the 21700 cylindrical cell study and expand the jigsaw of the air-cooling BTMS designs, this study focuses on developing a feasible air-cooling BTMS for Li-ion 21700 cylindrical Li-ion battery cells and optimizing both its thermal performance and cooling efficiency.
Effective BTMS design could prevent battery degradation, thermal runaway and improve the charging performance.7 In recent years, studies about improving the cooling performance of air-cooling BTMSs are sprouting. Pesaran et al.8 discussed active cooling versus passive air cooling and liquid cooling versus air cooling. They concluded that air cooling was less complicated and was generally adequate for low-power EVs. Fan et al.9 found that two-side air cooling with uneven neighbouring cells gap spacing could effectively improve the temperature uniformity. Zhao et al.10 also proposed a novel variable vertical cell spacing air-cooling BTMS design to obtain lower Tmax and better temperature uniformity. Lu et al.11 increased the cooling efficiency of an air-cooling BTMS by increasing the quantity and size of the cooling ducts. Chen et al.12 suggested an optimization strategy by adjusting the spacing around the battery cells according to the temperatures after certain operations: increasing the spaces around hotspot cells and decreasing the space around the colder cells. The results showed that it could reduce the Tmax slightly. Jiaqiang et al.13 investigated the influences of the outlet positions on the cooling effects and found that the opposite inlet and outlet battery pack structure was the optimized design. Wang et al.14 designed an air-cooling BTMS with two outlet position options. The cooling efficiency of Design 1 (73.0%) was better than Design 2 (62.3%), revealing that only the outlet positions could influence the cooling effects without any other changes. Chen et al.15 constructed a symmetrical air-cooling BTMS with varied battery cell spacings. The symmetrical models delivered better cooling effects than the corresponding asymmetrical designs.
The objective of this study is to investigate the cooling performance of a novel air-cooling BTMS with a battery pack of 42 (6 × 7) Li-ion 21700 cylindrical battery cells under different operating conditions (different inlet air velocities and discharging rates). Different from other designs of only a single inlet/outlet structure in the literature, this paper proposed a novel structure of air-cooling BTMS with multiple inlets/outlets designs. The cooling performance of the system with different multiple inlets/outlets cooling channel structures was investigated. The effects of various inlet/outlet positions and dimensions on the BTMS cooling performance were thoroughly evaluated and compared. The optimal inlet/outlet position and dimension were identified based on the maximum battery temperature and the temperature uniformity in the air-cooling field. The field synergy principle (FSP) was adopted to explain and justify the phenomena that appeared in the study. This study contributes useful design concepts for enhancing the cooling performance of air-cooling BTMSs with the least design modification by optimizing the airflow inlets and outlets – symmetrical double inlets/outlets structure with suitable outlet dimensions was proposed.

Description of the air-cooling BTMS

The Li-ion 21700 cylindrical cell is recently developed with advantages of higher energy density and lower manufacturing costs than the conventional 18650 counterparts. The 3D geometric modelling of the air-cooling BTMS is designed by ANSYS Fluent V19.1 (Fluid Flow) Design Modeler Function. The 21700 cell geometrical design dimensions are listed in Supplementary Table 2. The electrochemical model is based on the properties of a typical NCM622 Li-ion battery cell with lithium nickel cobalt manganese oxide anode, carbon cathode, ethylene carbonate-dimethyl carbonate-diethyl carbonate electrolyte and monolayer polypropylene membrane separator.16
Figure 1(a) shows the dimensions and layout of the 6 × 7 battery pack. As shown in Figure 1(b), the two sides with fewer cell numbers (six cells) are the left side and the right side while the two sides with more cell numbers (seven cells) are the front side and the rear side. Both vertical and horizontal distances between adjacent battery cell centres are 30 mm, which was decided referring to some previous pertinent research.1719 All the vertical and horizontal distances between cell centres and inlet/outlet/walls are 20 mm. The dimensions of the battery pack case (flow region) are 100 mm (height) × 200 mm (width) × 220 mm (length). The total volume of the flow region (except the volumes of the battery cells and busbars) is 3.59 × 106 mm3. All 42 cells are connected in series, delivering a maximum voltage output of around 151.2 V (3.6 V nominal voltage for each cell). Two adjacent cells are placed upside down and connected by dumbbell-like busbars to form cathode–anode connections as shown in the highlighted areas in Figure 1(b).
Figure 1. 3D modelling of the battery pack: (a) layout and dimensions and (b) four major sides.
In the ANSYS settings, both anode and cathode tabs are defined as ‘tabzones’. Their material specifications are assigned with ‘Passive Material’. Second, cells are defined as the ‘cells’. Their material specifications are assigned with ‘Active Material’. In the battery cell module, busbars are the necessary components to connect every cell in either series, parallel or hybrid connections. The software could automatically identify the connection types based on the correct 3D geometric modelling. The busbar material specifications are also assigned with ‘Passive material’. The specifications of ‘Active Material’ and ‘Passive material’ are listed in Supplementary Table 3.20
Air-cooling BTMS cooling performance could be improved by increasing the heat exchange coefficient between airflow and battery cells. Three common methods to increase the heat exchange coefficient are (1) add auxiliary structures such as ribs, insertions and airflow boilers on the heat exchange boundaries; (2) change the flow mode and property inside the fluid domain; (3) enhance the heat and mass transport process on the local hot spots based on the FSP.21 The first method is another research topic that was not discussed in this study due to the space limitations, so there is no extra substructure on the original design, indicating a low overall design improvement cost The essence of the optimization design in this study is to change the layout of cooling channels to change the directions of the airflow within the BTMS based on the second method and investigate the corresponding cooling performance improvement. According to the past research,22 the FSP could be used to enhance the heat transfer coefficient of almost all kinds of flows including laminar/turbulent flow, parabolic/elliptic flow, natural/forced convection flow and steady/unsteady-state flow, so the cooling performance improvement in this study is presumably accompanied by the improvement of the synergy between temperature gradient field and air velocity field, which is generally in the scope of the third method.
The air-cooling BTMS designs with different inlet and outlet positions are shown in Figure 2. Designs 0 and 1 are both single-inlet/single-outlet designs with one left inlet for Design 0 and one front inlet for Design 1. Designs 2 and 4 are both double-inlets/double-outlets designs with opposite left and right inlets for Design 2 and opposite front and rear inlets for Design 4. Designs 3 and 5 are both double-inlets/quadruple-outlets designs with opposite left and right inlets for Design 3 and opposite front and rear inlets for Design 5. To make a fair comparison, the total inlet (s) areas of all six designs are purposely designed as the same value to that of the Design 0 (0.02 m2), which is the product of the height (0.1 m) and width (0.2 m) of the left side of the battery case. The height of the battery case consisted of one cell height (0.07 m) and two cell-to-wall distances (0.015 m). The width of the battery case consisted of five cell-to-cell distances (0.03 m) and two cell-to-wall distances (0.0145 m). The reason for choosing the whole cross-section area as the inlet size for the single-inlet/single-outlet design is that it could provide the largest spread and more uniform cooling air streamlines for the battery pack and save the energy loss from the electric fan to the battery pack. The reason for the reduced inlet sizes for the double-inlets/double-outlets designs is to provide an equal airflow volume, that is, equal rated cooling capacity, for all designs. The detailed inlet and outlet descriptions of each design are listed in Supplementary Table 4. According to FSP, the temperature gradient field in this study comes from the rectangularly arranged cylindrical battery cells. Because the battery cells are fixed in all the designs in this study, the temperature gradient field is always consistent with the airflow. To improve the synergy degree between temperature gradient field and velocity field, the alternative method is to improve the airflow velocity field. As a result, the inlet/outlet numbers, positions and dimensions are adjusted to generate different airflow velocity fields. Comprehensive simulations are conducted to find the design with optimal cooling performance. The design with the optimal synergy between the velocity field and inertial temperature gradient field is supposed to deliver higher heat transfer efficiency and cooling performance.
Figure 2. Air-cooling battery thermal management systems (BTMSs) with different inlet/outlet configurations (blue arrows denote inlet air, red arrows denote outlet air and the dark green areas denote the inlet).

Mathematical model simulation

In this study, the software of ANSYS Fluent V19.1 is used to simulate two major heat generation and transfer processes: (1) the heat generations from the electrochemical reactions inside the battery cells during charging and discharging and (2) the thermodynamics model of mass and heat transfer processes within the air flows and the BTMS regions.

Battery heat generation model

The dual-potential multi-scale multi-domain (MSMD) and electric circuit model (ECM) are selected as the simulation methodologies in this study. The conventional Newman's electrochemistry model is simplified in equation  (1)23:
V(σ)dV=AjdA
(1)
where ∇ is the Del operator, ϕ is the electric potential, j is the volumetric transfer current density, A is the surface area of the interface and σ is the electrical conductivity.
For the MSMD model, the battery electrical and thermal fields are expressed by equations (2) to (4)24:
ρbCpbTt(kbT)=q˙
(2)
(σ+φ+)=j
(3)
(σφ)=j
(4)
where ρb is the battery mass density, Cpb is the battery-specific heat capacity, T is the temperature, kb is the battery thermal conductivity, q˙ is the heat generation rate which consists of the Joule heat, the electrochemical reaction heat and the entropic heat, σ+ and σ are the anode and cathode effective electrical conductivities, φ+ and φ are the anode and cathode phase potentials.
For the ECM model, a diagram from the work of Chen et al.25 is proposed to illustrate its mechanism as shown in Figure 3. It is a surrogate model of six parameters including three resistors and two capacitors to simulate the internal electrochemical behaviours of a Li-ion battery cell.
Figure 3. Electric circuit model (ECM) model diagram.
The voltages and currents in the ECM can be solved by equations (5) to (8)25:
V(t)=VOC(SoC)+Vp+VnRo(SoC)I(t)
(5)
dUpdt=1Rp(SoC)Cp(SoC)Vp1Cp(SoC)I(t)
(6)
dUndt=1Rn(SoC)Cn(SoC)Vn1Cn(SoC)I(t)
(7)
d(SoC)dt=I(t)3600Qb
(8)
where V is the battery voltage, I is the battery current, VOC is the open-circuit voltage, SoC is the state of charge, Vp and Vn are the voltages of Rp /Cp and Rn /Cn, Ro, Rp and Rn are the resistance of resistor o, p and n, Cp and Cn are the capacitance of capacitor p and n, Qb is the total battery capacity.

Thermodynamics model

Mass, momentum and energy conservation equations are three fundamental equations for the mass and heat transfer simulation in ANSYS. For an incompressible ideal gas, the mass conservation is expressed by equation (9):
ρat=(ρava)
(9)
where ρa is the air mass density and va is the airflow velocity vector.
In an inertial reference frame, the momentum conservation is expressed by equation (10):
(ρv)t+(ρvv))=p+(τ¯¯)
(10)
where p is the static pressure and τ¯¯ is the stress tensor.
The energy conservation is expressed in equation (11):
ρaCpaTa+ρbCpbTbt=ka2Ta+kb2Tb+qb
(11)
where ρa, ρb, Cpa, Cpb, ka, kb, Ta and Tb are the density, specific heat capacity, thermal conductivity and temperature of the air and battery, respectively. 2 is the Laplace operator and qb is the battery heat generation rate.

Model validations

Thermal performance evaluation criteria

The maximum temperature (Tmax) and temperature difference (ΔT) are the two major thermal performance evaluation criteria in this study. To avoid adverse effects of high temperature such as accelerated degradation, capacity fading, and to suppress the occurrence of thermal runaway accidents,26 the ideal Tmax of Li-ion battery cells should be controlled lower than 40°C (313.15 K) and ΔT should be controlled lower than 5°C (5 K).2729

Battery heat generation model validation

To validate the heat generation predictions of the MSMD module and ECM submodel on a single 21700 cylindrical Li-ion battery cell, Figure 4 shows the comparison between the simulation results and experiment data from Ref.30 The root mean square values of the simulation results during 0.5C and 1C are 0.51 K and 0.80 K, respectively. The SDs of the errors of the simulation results are 0.41 K and 0.82 K, respectively.
Figure 4. Single battery cell heat generation simulation results validation.

Thermodynamics model validation

In addition to the single-cell mesh independency study and heat generation validation, experimental results in an air-cooling BTMS study with a rectangular battery pack of 4 × 8 18650 cylindrical cells in an acrylic wind tunnel, as shown in Figure 5(b) by Fan et al.31 are adopted to validate the heat transfer model in this study. The battery cells are connected in 4P8S (four cells in the same column in parallel and eight columns in series). 0.6 m/s, 1 m/s, 2 m/s, 3 m/s and 4 m/s are five inlet velocities. The cell centre distance is 22 mm. The distance between the acrylic tunnel wall and cell centre is 13 mm. Both room temperature and inlet air temperature are set as 20°C. The discharging rates are 0.5C, 1C and 2C. Figure 5(c) shows the temperature contour and air velocity streamlines at 1 m/s 20°C inlet air during 1C discharging. Figure 5(a) shows the Data comparison between simulation results in this study and the reference experimental results. The average errors between simulation and experimental results at five inlet velocities during 0.5C, 1C and 2C discharging are 0.12 K, 0.47 K and 0.37 K, respectively. The SDs of the values at three discharging rates are 0.35 K, 0.94 K and 0.33 K, respectively. Additionally, some measurement errors of the experiments were mentioned in the reference, which means the simulation results could be even closer to the real situations. As a result, this validation proved the reliability and accuracy of the thermodynamics model in this study.
Figure 5. (a) Data comparison between simulation results by the model of this study and experimental results in Ref.31; (b) experimental setup model from Ref.31; and (c) temperature contour and air velocity streamlines at 1 m/s 20°C inlet air during 1C discharging in the simulation of this study.

Results and discussions

Effects of inlet/outlet positions on the air cooling performance

The T
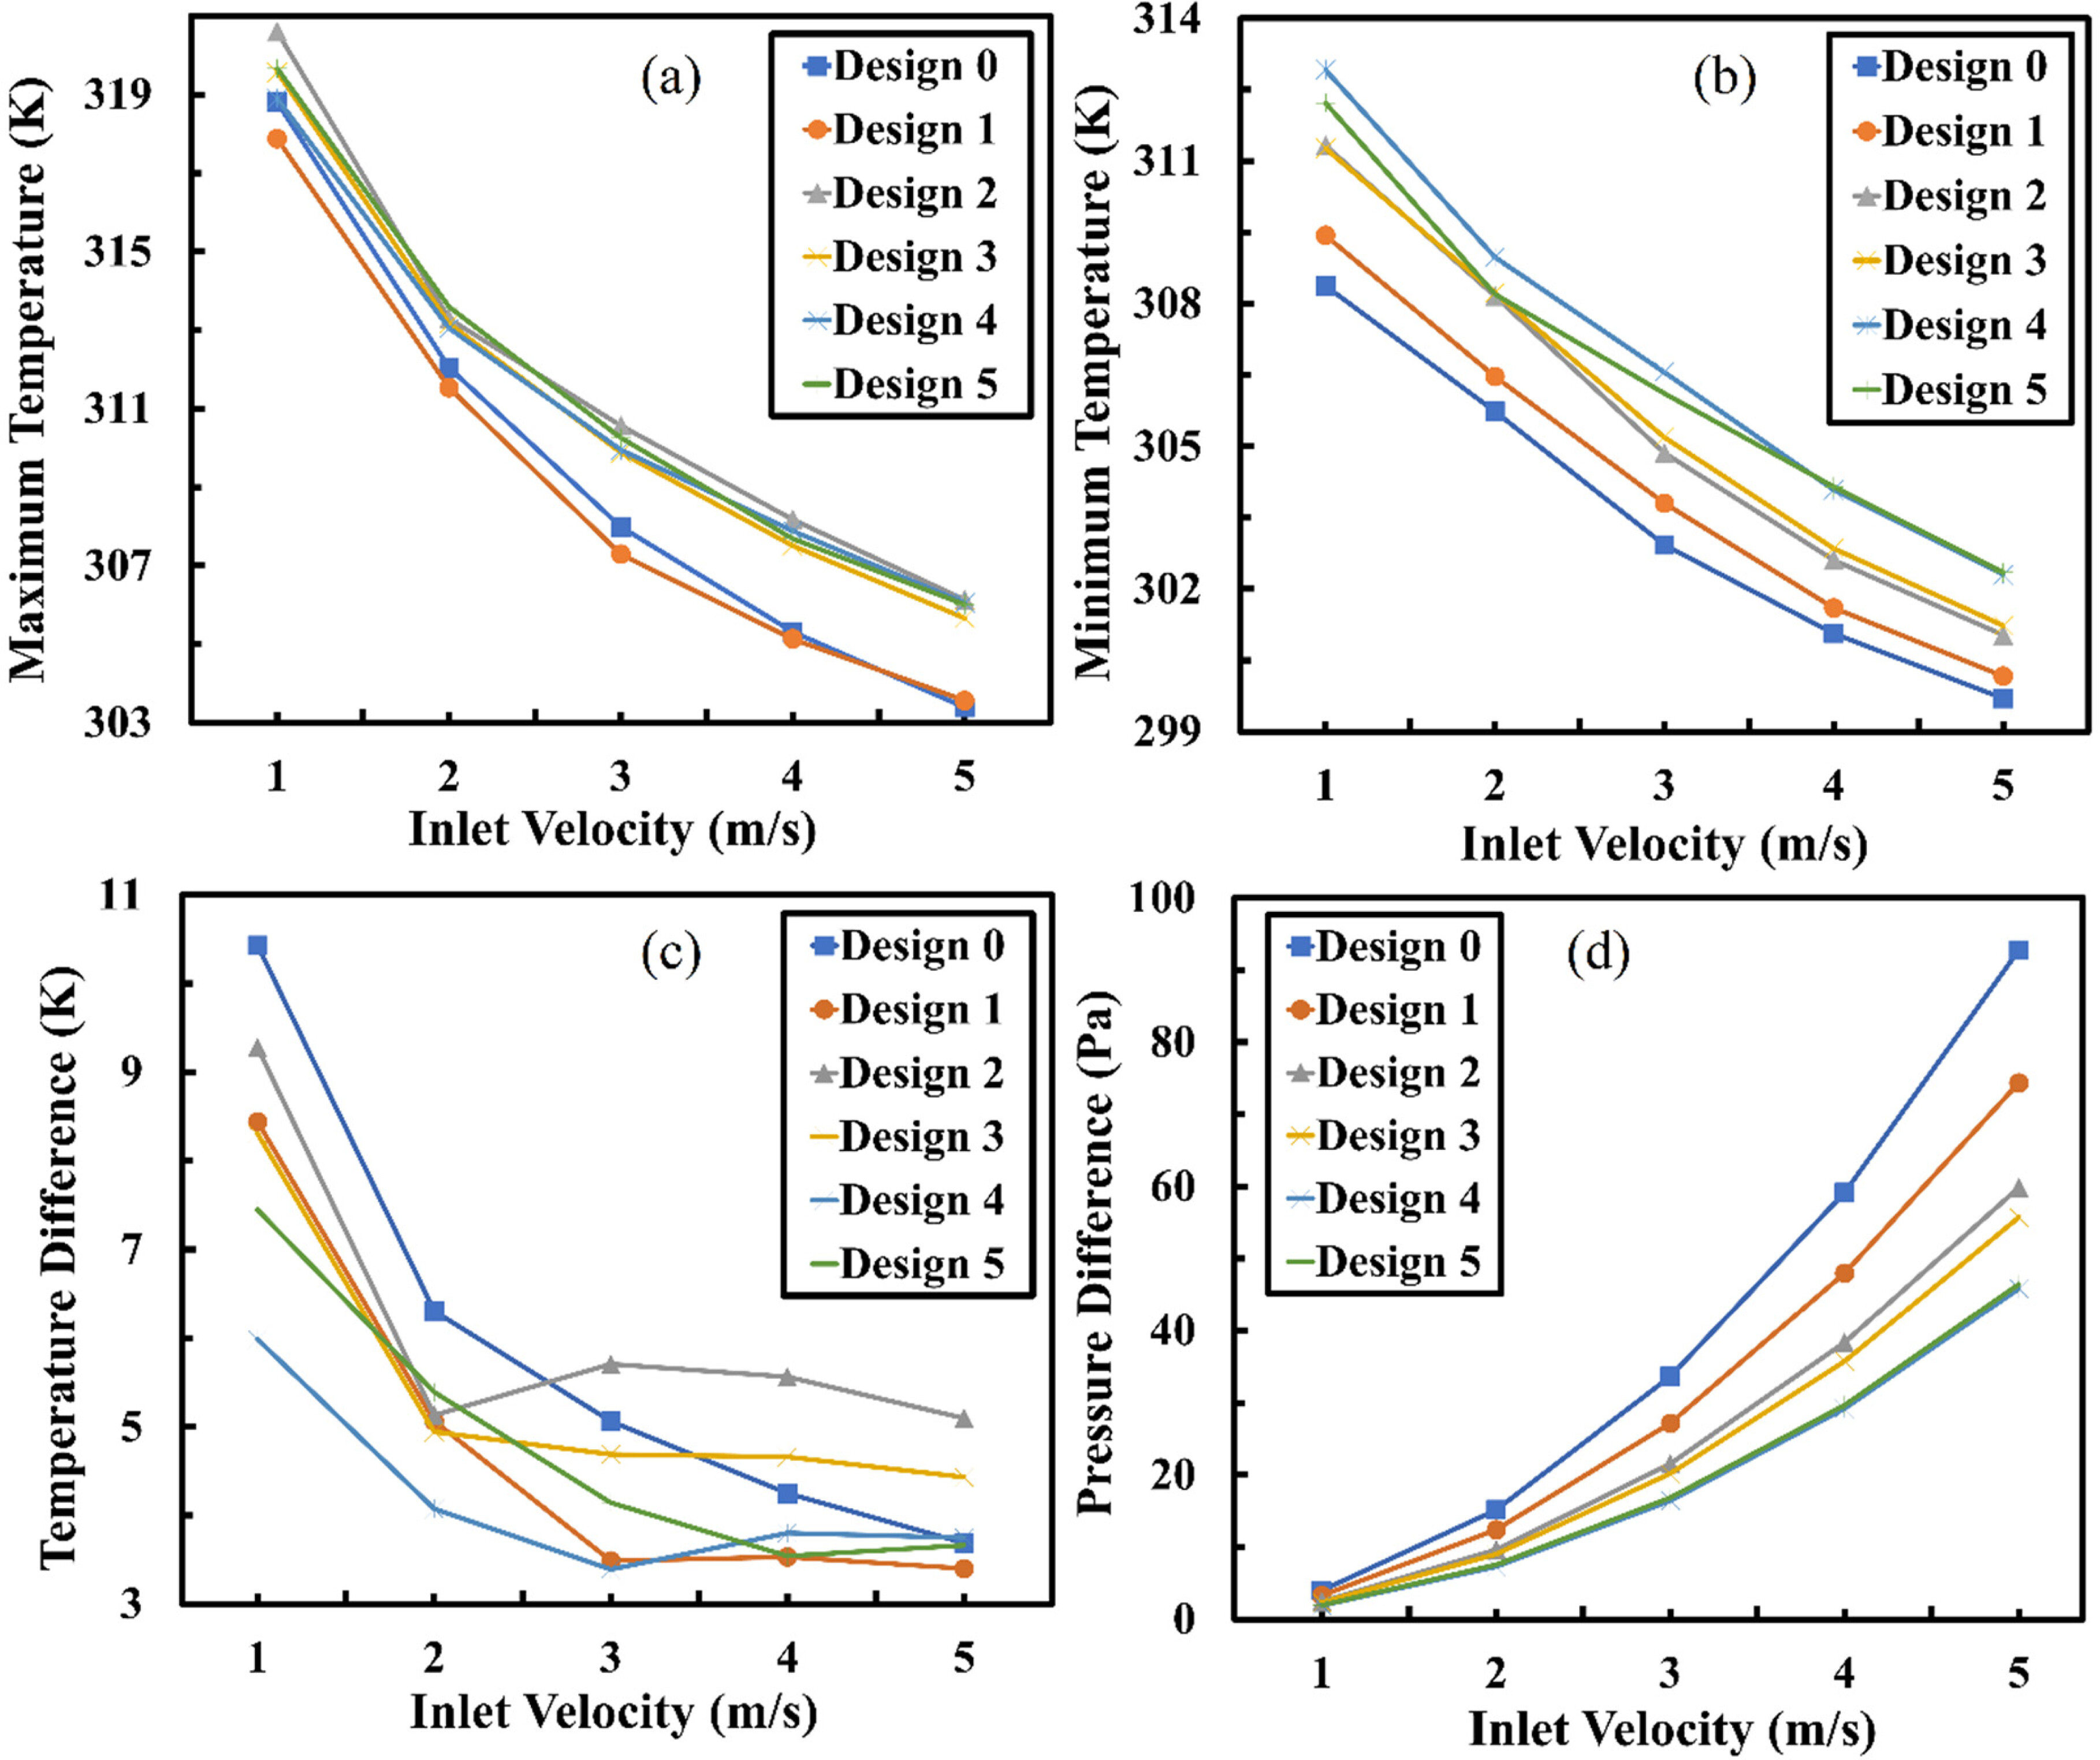
max, minimum temperature (Tmin), ΔT, the pressure difference (ΔP: the difference between average inlet pressure and average outlet pressure) of each design at different inlet air velocities are collected every 100 s of the flow time from 0 to 3000s. The relationships between these four major parameters and inlet velocities are shown in Figure 6. The general trends of all the designs were similar. As the airflow inlet velocity increases, the Tmax, Tmin and ΔT decrease while the ΔP increase.
Figure 6. The relationships between Vinlet and (a) Tmax, (b) Tmin, (c) ΔT and (d) ΔP.
At the inlet velocity of 1 m/s, all designs showed unsatisfactory performance in terms of T
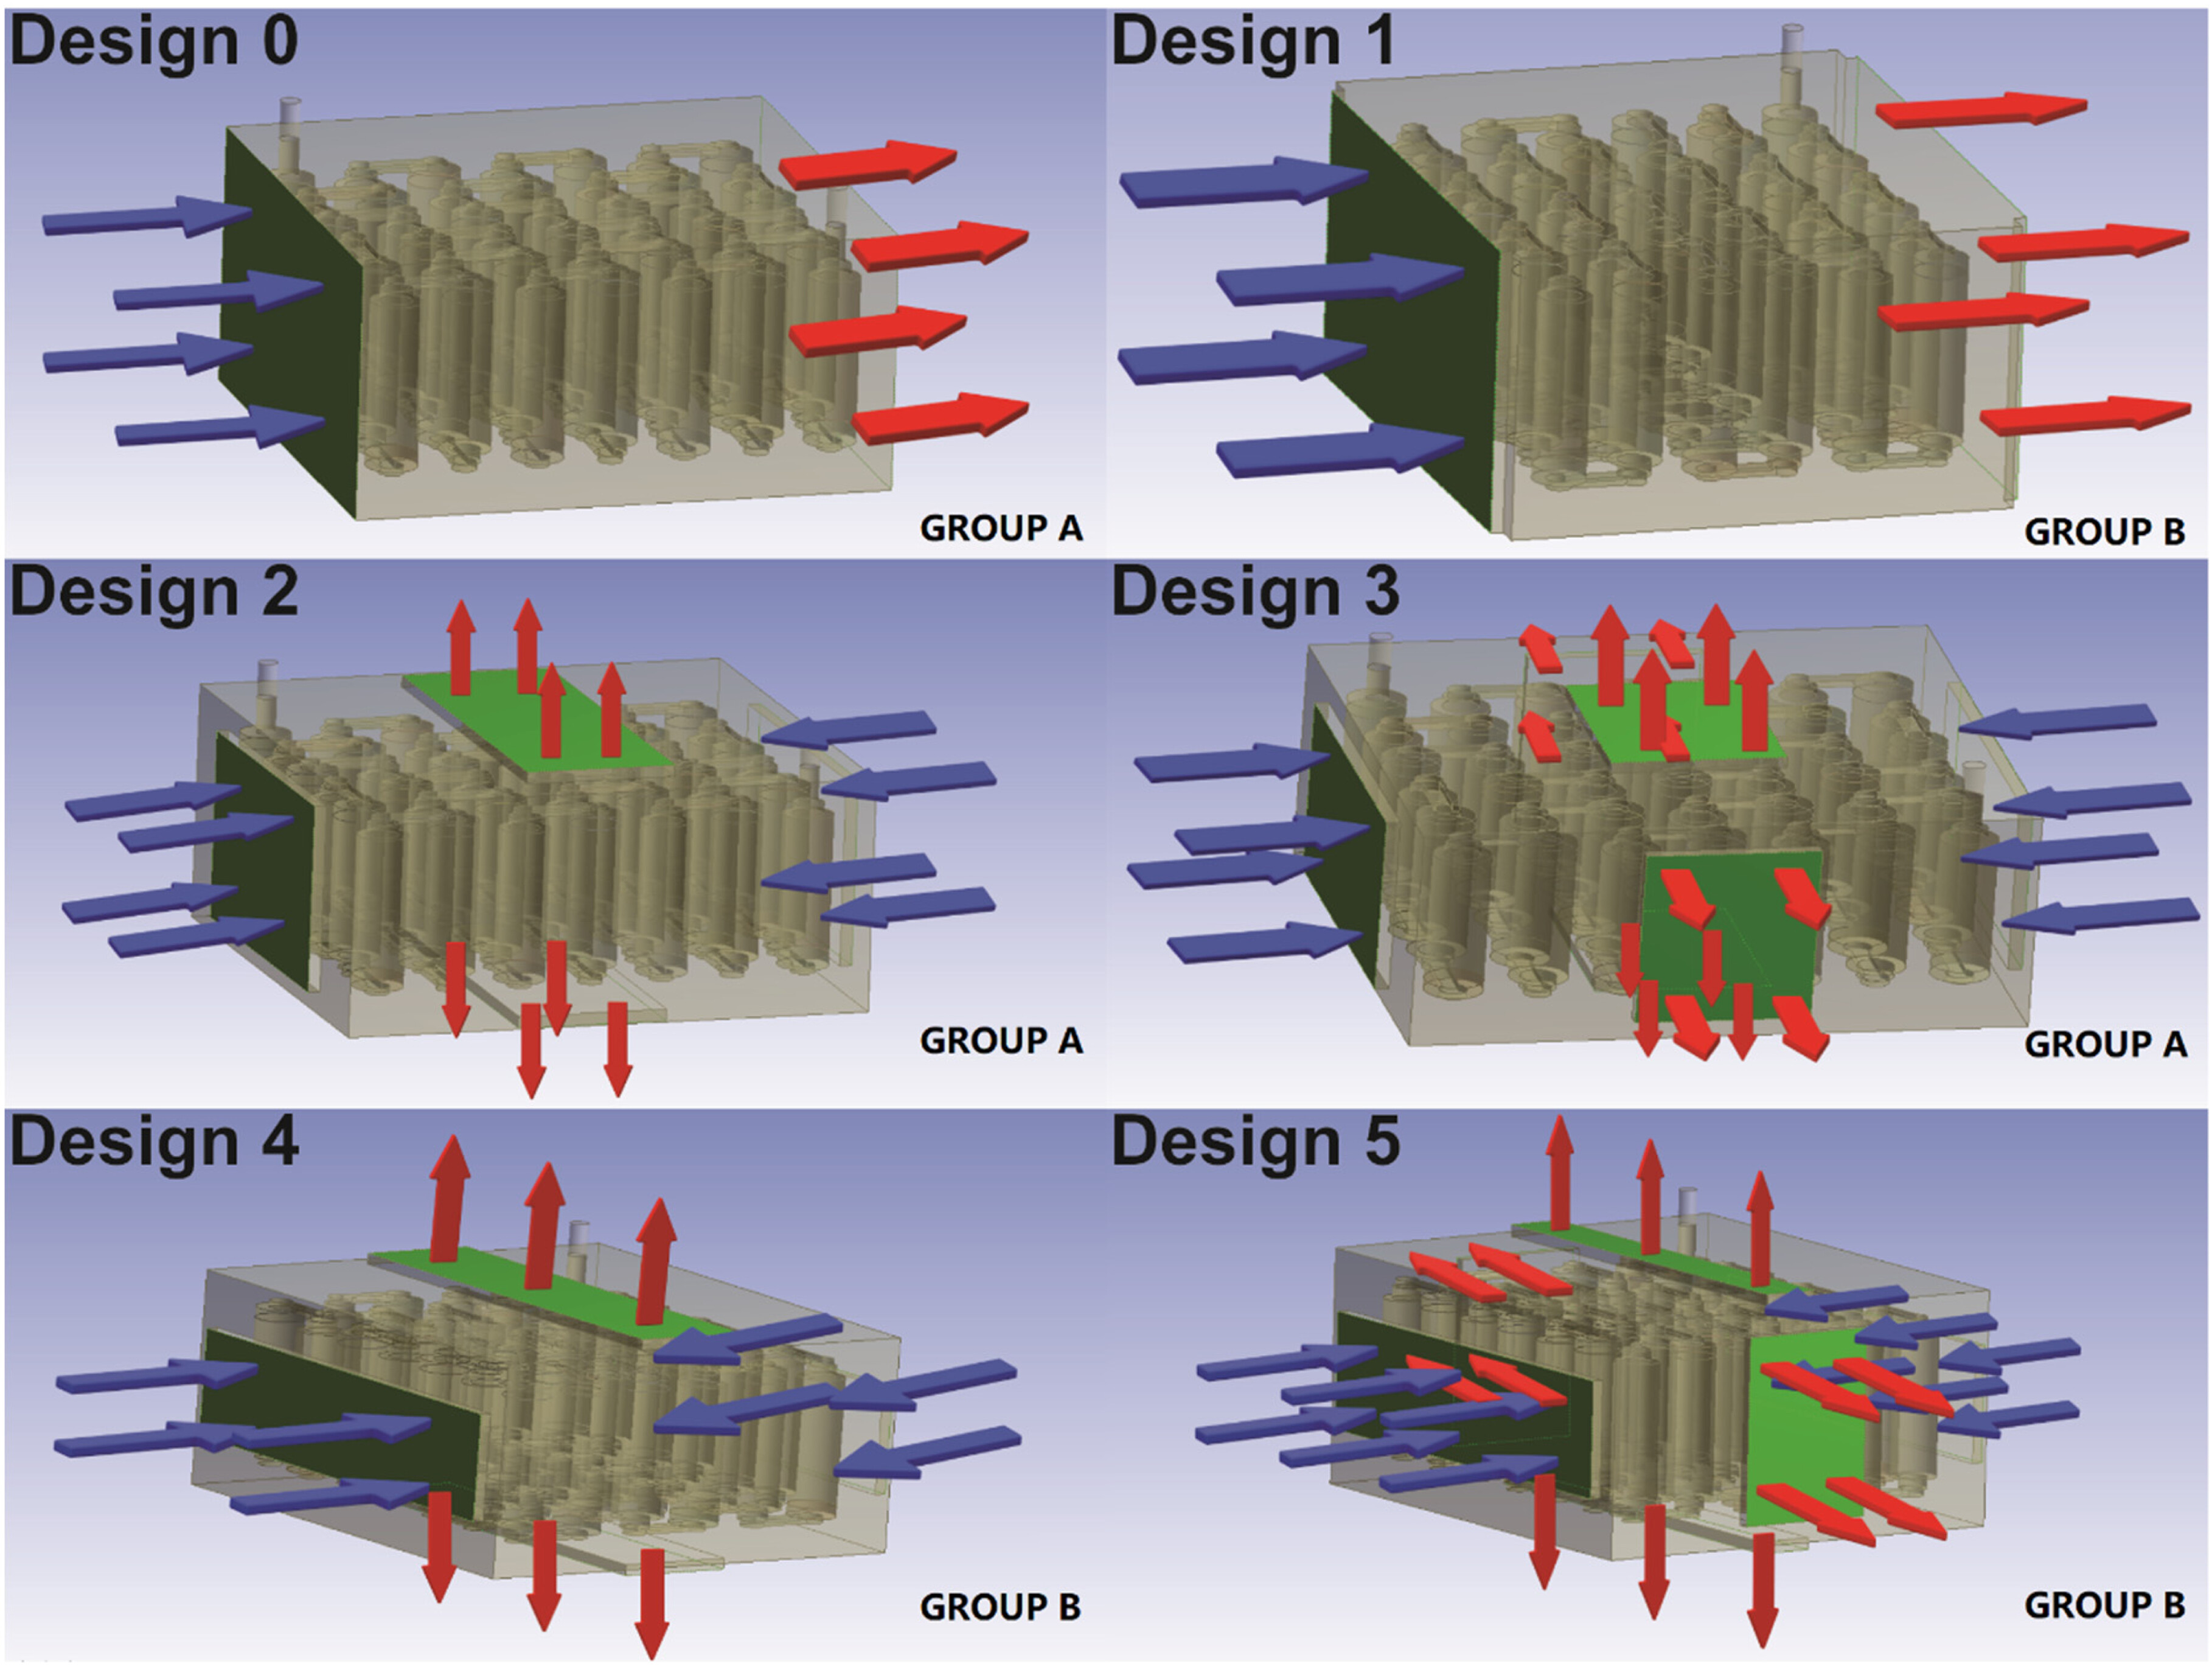
max and ΔT. Design 0, Design 1 and Design 4 exhibited lower T
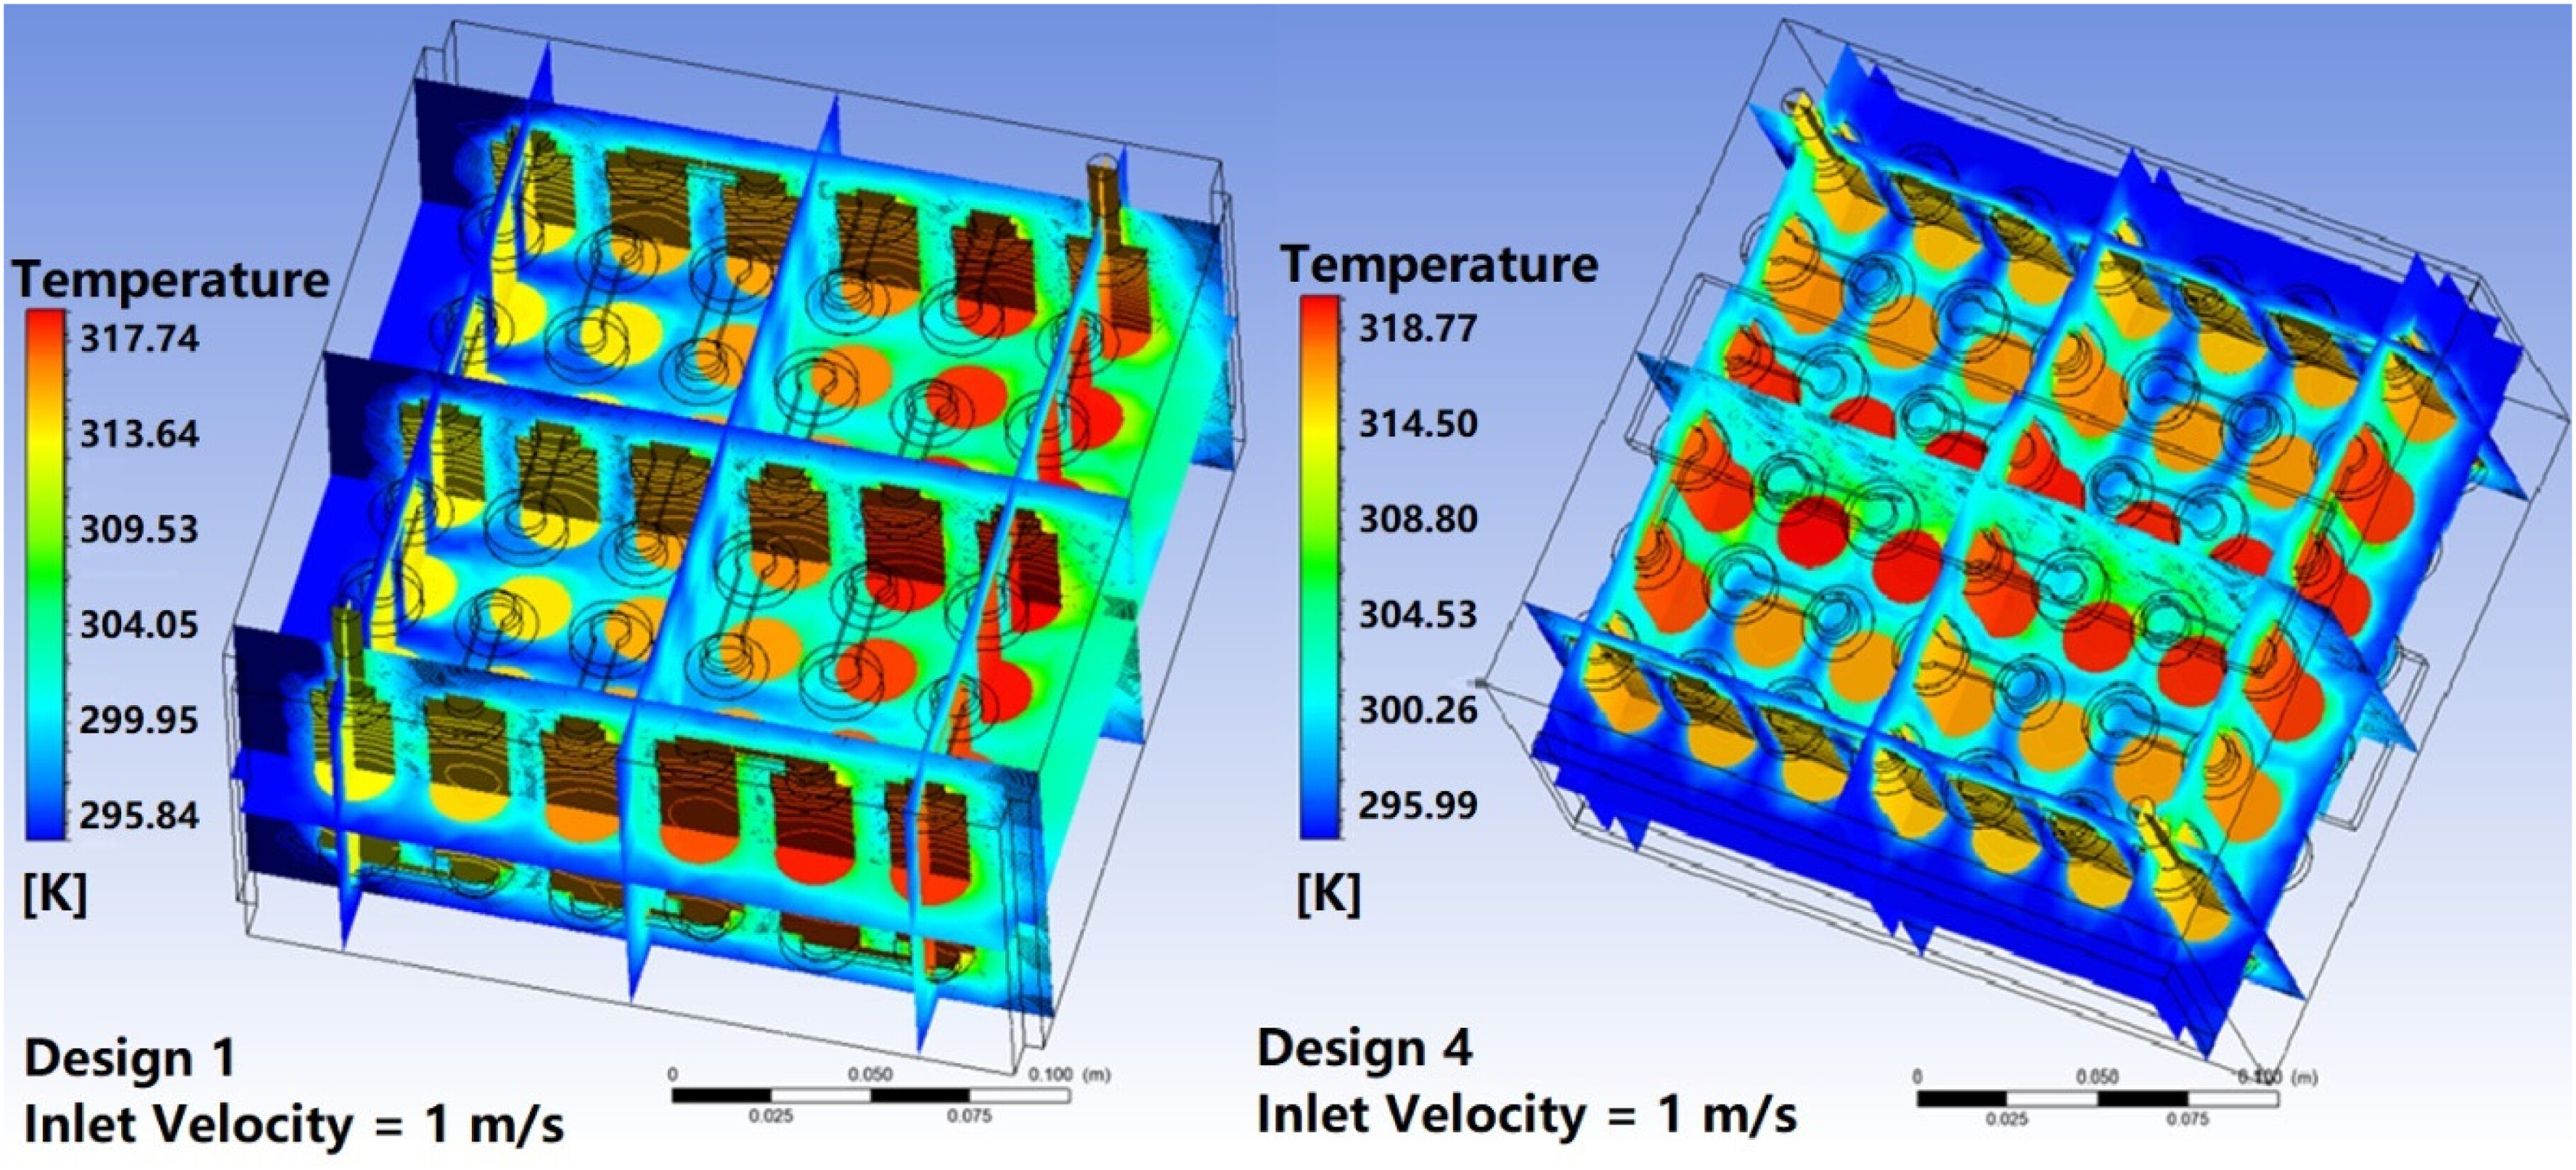
max among all the designs, which were 318.8 K, 317.87 K and 318.9 K, respectively. However, the ΔT of Design 0 and Design 1 were the highest among all the designs. At low inlet velocity (1 m/s), none of the designs met the requirement, but Design 4 still exhibited better overall cooling performances than other designs. The drawbacks of Design 0 and Design 1 were their uneven temperature distributions. From Figure 7, although the Tmax of Design 1 was the lowest one among all the designs, the ΔT between the cells near the inlet and the cells near the outlet reached more than 8 K. At low inlet velocity, the single inlet/outlet structure would cause significant ΔT, which was proportional to the distance between inlet and outlet.
Figure 7. Temperature distributions of Design 1 and Design 4 (Vinlet = 1 m/s).
When the inlet velocity reached 2 m/s, the Tmax of Design 0, Design 1 and Design 4 and the ΔT of Design 3 and Design 4 met the requirements. Design 4 was the only design that met both the requirements. Design 0 showed the highest ΔT due to its longest distance between inlet and outlet. Design 1 showed a lower Tmax (311.53 K) than Design 0 since its inlet to outlet distance was shorter than that of Design 0. For the same reason, the ΔT of Design 1 was smaller than Design 0. Shorter air-cooling channel length (inlet to outlet distance) was found to be beneficial to reduce both T
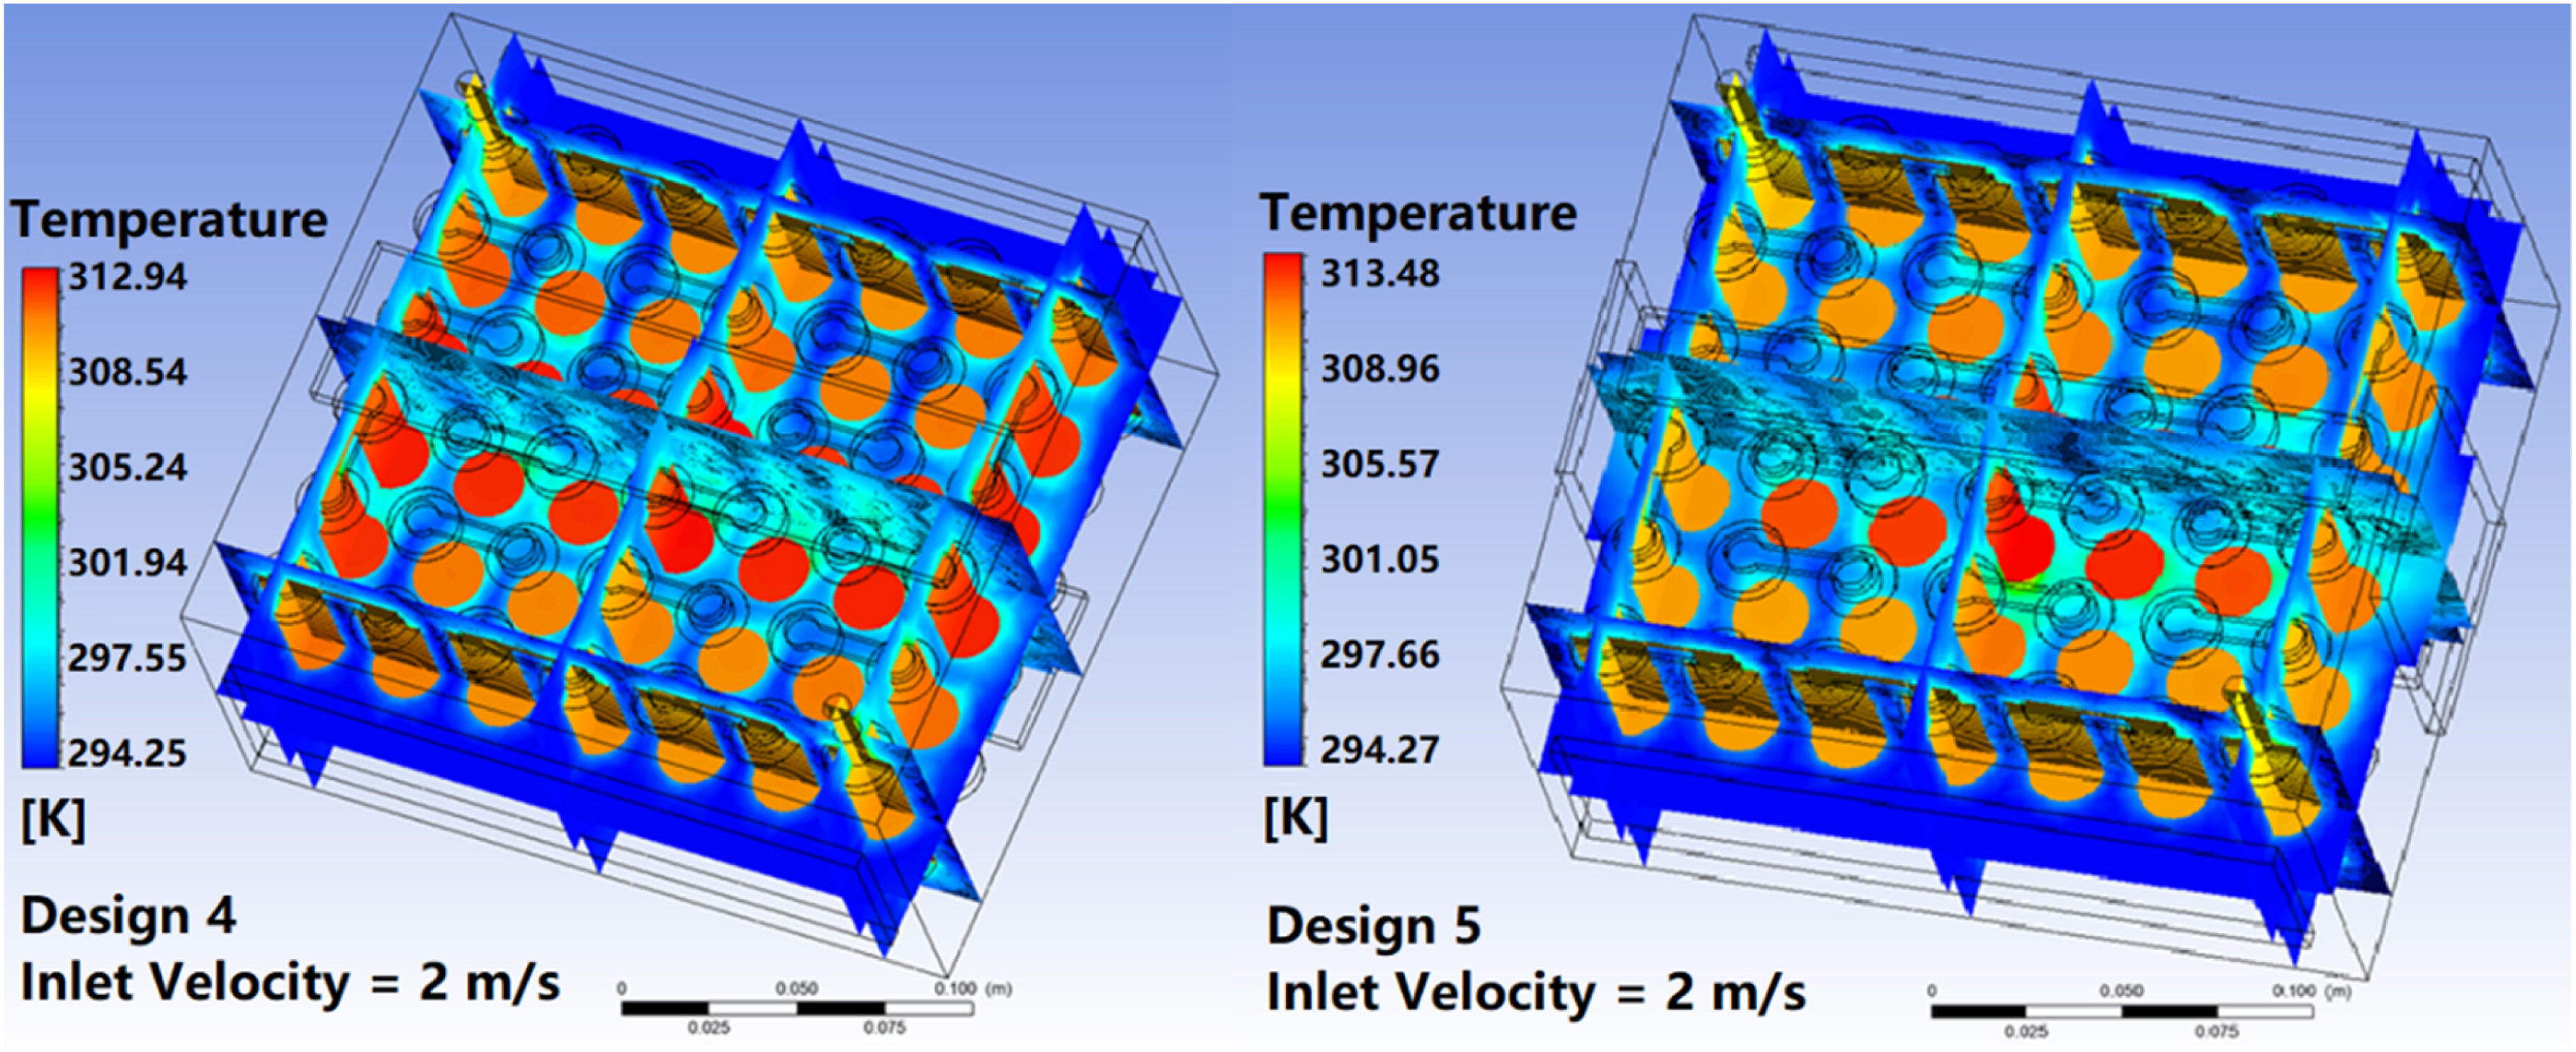
max and ΔT. The temperature distributions of Design 4 and Design 5 are shown in Figure 8. The inlet and outlet areas of these two designs were the same, but the outlets of Design 5 were divided into four pieces on the left, right, top and bottom faces while the outlets of Design 4 were just two pieces equally divided on the top and bottom faces. The simulation results showed that both Tmax and ΔT of Design 4 were lower than Design 5, especially the ΔT of Design 4 was 25% lower than that of Design 5. More outlet quantity does not necessarily mean better cooling performances. If the outlet positions were not suitable, it would adversely release unheated air before the sufficient heat exchange processes between air and cells, causing larger Tmax and ΔT.
Figure 8. Temperature distributions of Design 4 and Design 5 (Vinlet = 2 m/s).
In the scenario of 3 m/s inlet velocity, the Tmax of six designs were all lower than 313.15 K, but the Design 0 and Design 2's ΔT were higher than 5 K. From the comparison of the temperature distributions of Design 1 at 1 m/s and 3 m/s, the temperature uniformity improved obviously as the inlet velocity increased. The high ΔT between the cells near the inlet and the outlet disappeared probably due to three reasons: (1) the fast inlet airflow did not carry as much heat from the cells close to the inlet as it did when the airflow velocity was lower, that is, not enough time for heat exchange; (2) there was sufficient unheated airflow at the end of the cooling channel to cool down the cells close to the outlet; (3) the synergy angle between the direction of the temperature gradient field and the direction of the velocity field became 0 (both were from the inlet to the outlet), which meant the highest heat transfer efficiency was achieved. As a result, the temperature uniformity improved significantly when the inlet velocity reached 3 m/s. In Figure 6(c), all designs exhibited temperature uniformity improvements from 1 m/s to 2 m/s as well as from 2 m/s to 3 m/s. Only the ΔT of Design 2 increased from 2 m/s to 3 m/s. The reason was that its Tmin decreased a lot from 2 m/s to 3 m/s in Figure 6(b), causing a larger ΔT contrarily. In conclusion, reducing the battery Tmax is not the only objective of a good air-cooling system, a well-designed BTMS should also deliver excellent temperature uniformity. Both hot and cold spots should be avoided to obtain a satisfactory temperature uniformity.
At 4 m/s airflow inlet velocity, although Tmax and Tmin in all designs kept decreasing, the ΔT improvements of Design 1, Design 2, Design 3 and Design 4 were almost neglectable or even backwards. In Figure 6(a) and (b), the slopes of both Tmax and Tmin increased slightly, which meant the cooling effect improvements due to the increase of the inlet velocity are going down. Presumably, increasing the inlet velocity could reduce system temperature, but the cooling effect improvement from 3 m/s to 4 m/s was not as good as that from 1 m/s to 2 m/s. There would be some thresholds of the cooling performance improvements as the inlet velocity was continuously increasing because the temperature of the inlet air was fixed. The smaller the gap between inlet air temperature and battery cells temperature is, the lower cooling efficiency the system will deliver. The battery cells will never be cooled down below the inlet air temperature.
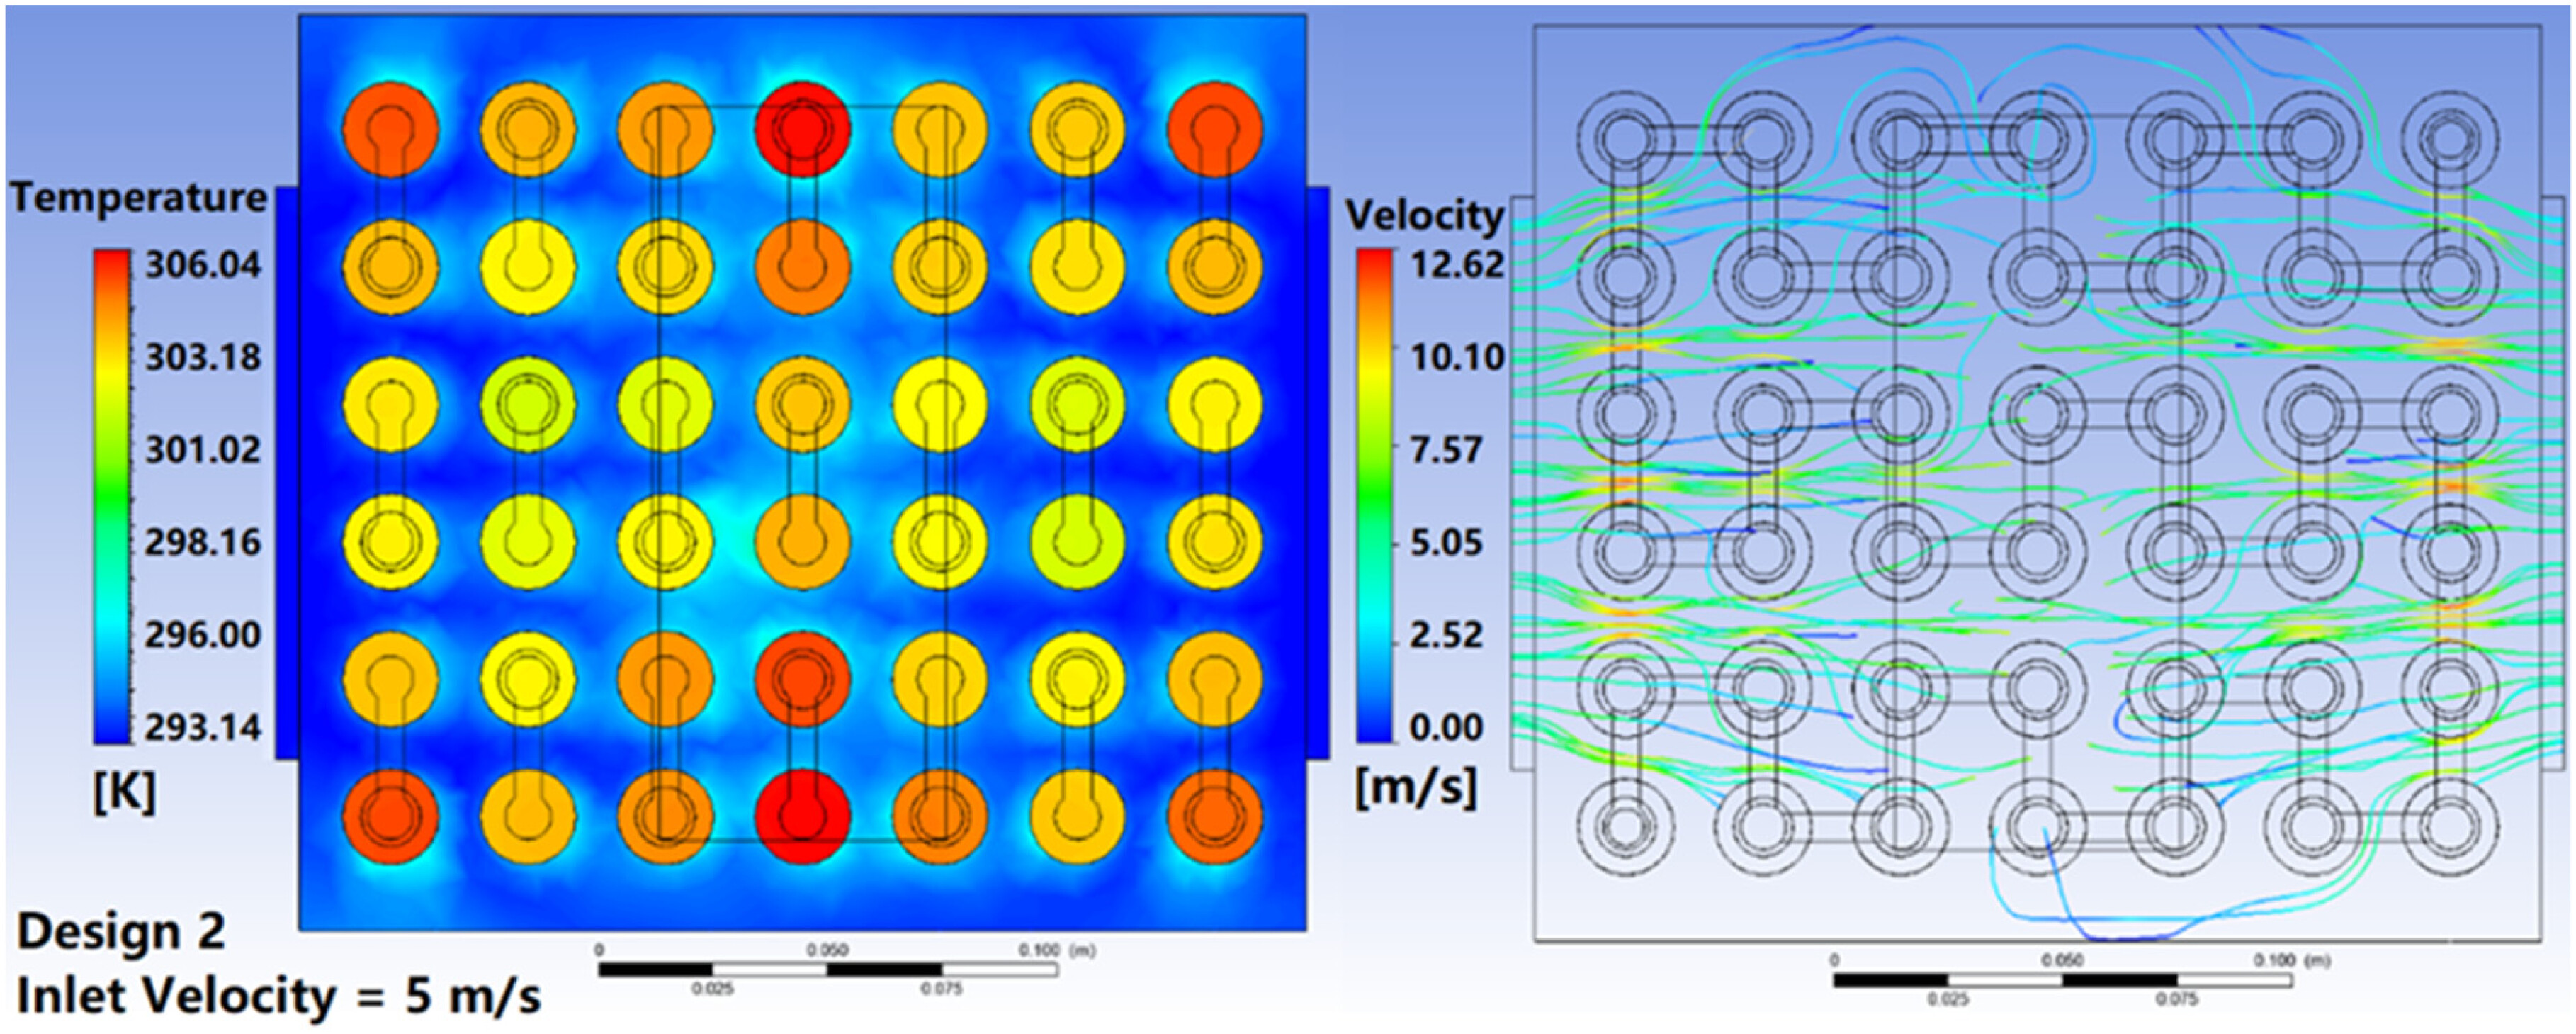
The overall thermal performances at 5 m/s were similar to those at 4 m/s. The ΔT of Design 2 was still larger than 5 K. The temperature and airflow velocity distributions of Design 2 was shown in Figure 9. The hot spots usually occurred in the places where airflow velocities were relatively low. The stagnant air flows diminished the heat convection and conduction processes between cells and air. Designers should optimize the cooling channels to avoid low-velocity spots. Design 0 offered the lowest Tmax at 5 m/s while its Tmax was higher than Design 1 at 1 m/s. When the airflow is sufficient (inlet velocity is high), the longer cooling channel could provide better cooling performance to reduce Tmax. On the other hand, the ΔP of Design 0 was the highest among all designs. Due to the viscous loss, high-pressure difference between outlet and inlet means high energy loss, indicating the energy consumption of the active air-cooling system is high. Design 2 and Design 3 delivered very close pressure difference values due to their similar inlets and outlets positions as well as their BTMS layouts. And so did Design 4 and Design 5. Generally, ΔP is relevant to the layout of the BTMS designs, including the inlet and outlet positions, numbers, sizes, as well as cooling channel distributions.
Figure 9. Temperature and airflow velocity distributions of Design 2 (Vinlet = 5 m/s).
In conclusion, a good air-cooling BTMS design should be able to reduce Tmax as much as possible and keep Tmin sticking to Tmax to achieve a minimum ΔT. Both hot spots and cold spots shall be avoided in a well-designed air-cooling BTMS. Second, the effects of cooling performance improvement by increasing the inlet velocities are more apparent in reducing the temperatures (Tmax and Tmin) than the ΔTs. Higher inlet velocity means more energy consumption, if the requirement (Tmax ≤ 313.15 K and ΔT ≤ 5 K) is already met, it is not economic to further increase the inlet velocities because the extra energy consumption will compromise the overall driving ranges. From the simulation results and the above analysis, only Design 4 could meet all requirements when the inlet velocity was 2 m/s. Even at 3 m/s inlet velocity, its cooling performance was still among the top designs. At 2 m/s inlet velocity, the Tmax of Design 4 was 313.05 K and its ΔT was 2.24 K (35.5%) lower than the basic design 0 with a minimum ΔP of 1.92 Pa among Designs 0–5. So, Design 4 is the optimal air-cooling BTMS design among all six designs in this study.

The effects of outlet dimensions on the cooling performance

To investigate the relationship between outlet dimensions and cooling effects, this study proposed four derivative designs with different outlet widths (W) based on the optimal Design 4 in Supplementary Table 5.
The outlet widths (W) of Designs 6, 7, 8, 9 and 4 (0.01 m, 0.02 m, 0.03 m, 0.04 m and 0.05 m) were shown in Figure 10. Except for the outlet dimensions, all other parts were identical. Simulations were carried out under the same operating conditions to evaluate the influence of the outlet widths on the cooling effects.
Figure 10. Designs 6, 7, 8, 9 and 4 with outlet widths from 0.01 m to 0.05 m.
Supplementary Figure 11 showed the simulation results of the air-cooling BTMS with five different outlet dimensions. Generally, the differences between Tmax and Tmin of five designs at different inlet velocities were not large, but ΔT showed some obvious divergences when the inlet velocity was higher than 2 m/s. Lower Tmax and higher Tmin are beneficial to the temperature uniformity. Coincidentally, the 0.02 m design exhibited the most numbers of lowest Tmax (three times), highest Tmin (three times) and lowest ΔT (three times). It delivered optimal cooling performances with both the lowest Tmax and ΔT when the inlet velocities were 3 m/s, 4 m/s and 5 m/s. After the inlet velocity reached 2 m/s, all 5 designs had met the requirements (Tmax ≤ 313.15 K and ΔT ≤ 5 K). At 2 m/s, the 0.03 m design showed both the lowest Tmax and ΔT. Compared with the original 0.05 m Design 4, 0.03 m design provided a 0.47 K reduction in Tmax and a 0.28 K reduction in ΔT with a minor 15.61 Pa ΔP increase. On the other hand, ΔP of the smaller outlet width designs were exponentially higher than larger ones as shown in Supplementary Figure12. ΔP of 0.01 m design was over 10 times higher than 0.05 m design at all five inlet velocities, indicating significantly higher energy consumptions of smaller outlet dimensions. ΔP of 0.03 m design was only about half of 0.02 m design, showing a major benefit of saving the energy consumption.
As a result, Design 4 with 0.03 m outlet and a 2 m/s inlet velocity was considered an optimal combination of both lowest Tmax (312.58 K) and ΔT (3.79 K) in addition to a reasonable energy consumption level (14.9 Pa). Compared with the worst case of 0.05 m design (Tmax = 313.05 K, ΔT = 4.07 K), Tmax and ΔT had been improved by 0.15% and 6.88%, respectively.

The optimal design with different discharging rates, ambient temperatures and inlet airflow velocities

To give a detailed understanding of the real working conditions of the EV battery pack and investigate the cooling performances of the air-cooling BTMS during these operations, different ambient temperatures, discharge rates and inlet air velocities should all be considered. In this section, the optimal design would be tested with more than 52 groups of new simulations with different discharging rates (0.5–1.5C), ambient temperatures (10–30°C) and inlet airflow velocities (0.2–14 m/s) to check its practicality in real application scenarios and efficiency under various operating conditions. Theoretically, the average discharging rate of an EV is about 0.1C, which could provide a continuous 10-hour operating time to cover a 500 km milage with a speed of 50 km/h. The 1.5C could already be considered as the higher discharging rate since it is 15 times of the theoretical average discharging rate. The 3–5C or higher C-rate could be implemented in the fast charging and abusive driving scenarios, which could be further explored in some specialized research by more advanced cooling methods while the pure air-cooling BTMS could hardly handle. By the definition from Li et al.,32 fast charge has been coined for charging rates of about 4C (i.e. a theoretical 15-minute charge) but less than 6C (i.e. a theoretical 10-minute charge). So, the discharging rates of 0.5–1.5C were specially investigated in this part.
The simulation results were shown in Supplementary Figure 13. Generally, the differences between Tmax and Tmin at different ambient temperatures were almost equivalent to the differences of the ambient temperatures in the same operating conditions. Theoretically, since Tmax and Tmin were simultaneously affected by the ambient temperatures, ΔT was almost not influenced by different ambient temperatures. Moreover, ΔP was mainly resulted from the frictional and viscous losses within the cooling channels and dominated by inlet velocity, cooling channel structure, inlet/outlet dimensions, etc. So, in Supplementary Figure 13, the ambient temperatures were not considered a relevant factor in the relationship between ΔT/ΔP and inlet velocities. Instead, the discharging rate was chosen as the main operating condition to assort the simulation results as shown on the right part of Supplementary Figure 13.
During 0.5C discharging (2 A discharging current), the cooling effect of the optimal design was satisfactory that even lower inlet velocities (0.4 m/s) could meet the temperature requirement. At 283.15 K, the inlet velocity of 0.4 m/s could deliver a required cooling performance with a Tmax of 296.51 K and a ΔT of 3.77 K. When the inlet velocity was increased to 5 m/s, Tmax and ΔT were reduced to 288.47 K and 1.53 K, respectively. The cooling performance at 293.15 K was the same as that at 283.15 K, so a 0.4 m/s inlet airflow was sufficient. At 303.15 K, the minimum inlet velocity meeting the temperature requirement rose to 0.8 m/s. Tmax and ΔT at 0.8 m/s inlet velocity during 0.5C discharging were 312.93 K and 2.18 K, respectively.
During 1C discharging (4 A discharging current), the cooling effect of the optimal design is reduced with the increase in heat generation. When the ambient temperature was 283.15 K, 2 m/s inlet velocity was sufficient to deliver the required cooling performance with Tmax and ΔT of 302.97 K and 4.36 K, respectively. The cooling performance could be enhanced to Tmax (296.35 K) and ΔT (3.88 K) when the inlet velocity was increased to 5 m/s. Similarly, 2 m/s was also the minimum inlet velocity for the design to deliver qualified thermal performance when the ambient temperature is 293.15 K. At 303.15 K, none of the inlet velocities from 1 m/s to 5 m/s could maintain the Tmax below 313.15 K despite the ΔT could still be effectively controlled within 5 K when the inlet velocity was greater than 2 m/s. The lowest Tmax (316.35 K) could be achieved when the inlet velocity was 5 m/s. The limitation of the air-cooling method started to be exposed when the ambient temperature (inlet air temperature) was close to the upper limit of the ideal temperature range (313.75 K), which was also a challenge to all cooling methods that the cooling performances could greatly compromise when the margin between coolant and threshold was relatively small.
During 1.5C discharging (6 A discharging current), none of the cooling performances at all three ambient temperatures was satisfied due to high ΔT. At 283.15 K, 8 m/s inlet velocity could deliver a required Tmax of 304.97 K, but the ΔT was 7.44 K. Even if the inlet velocity was increased to 14 m/s, the ΔT was still 5.76 K, which was 15.2% higher than the 5 K requirement. At 293.15 K, 11 m/s could keep the Tmax below 313.15 K, but its ΔT was still 1.29 K higher than 5 K. When the ambient temperature was 303.15 K, 14 m/s inlet velocity could not provide the required cooling performance. Its Tmax (317.58 K) was 3.83 K higher than 313.15 K and its ΔT (5.76 K) was 0.76 K higher than 5 K. Under the severe operating conditions of both high ambient temperature and discharging rate, the optimal air-cooling BTMS design could not provide the required temperature range for the battery pack.
Basically, if the average operation hours of a fully charged EV battery pack from 100% SoC to 0% SoC is 10 h, the average discharging rate of the battery pack is presumably to be 0.1C, which is around 10 times lower than the simulation discharging rates in this study. The additional simulation results in this section exhibited the superb cooling performances of the optimal design during mild and above-average EV working conditions (0.5C and 1C discharging operations), especially the air-cooling process during 0.5C discharging at 0.4 m/s inlet velocity was an effective energy-saving strategy for the EV BTMS. The air-cooling strategy of 2 m/s inlet velocity during 1C discharging was also effective for most of the working conditions. Nonetheless, a perfect BTMS is supposed to be able to tackle extreme working conditions. The 1.5C discharging rate could be considered as abusive driving condition since it is 15 times higher than the EV theoretical discharging rate. The air-cooling BTMS design in this study could hardly tackle this working condition even though the inlet velocity was increased to 14 m/s. If abusive discharging is unavoidable, the maximum inlet velocity is 14 m/s, and the ambient temperature is 303.15 K (30°C), the only adjustable variant is the inlet air temperature. Auxiliary inlet air pre-processing methods such as air conditioning or thermoelectric cooler should be introduced to achieve the desired cooling performance of the air-cooling BTMS during extreme working conditions.

Conclusion

To cope with the more stringent cost reduction and technical development demands of the EV manufacturing industry, this study thoroughly explored an air-cooling BTMS design and successfully improved its cooling efficiency with least modifications to the original battery pack layout by optimizing the positions and dimensions of the inlets and outlets. According to the simulation results of the basic design and all its derivative designs, Design 4 with symmetrical double inlets/outlets was found to be the optimal design since it first met both thermal requirements at 2 m/s flow rates: Tmax was 313.05 K (< 313.15 K) and ΔT was 4.07 K (< 5 K). Based on Design 4, the optimal 0.03 m outlet width design could further reduce Tmax and ΔT by 0.47 K (0.15%) and 0.28 K (6.88%) than the worst 0.05 m design. The optimal design exhibited superb cooling performances during 0.5–1C discharging at 10–30°C ambient temperatures. However, its cooling performance at the high discharging rate (1.5C) was proven to be insufficient, so the auxiliary inlet air pre-cooling method is recommended to reach the ideal temperature range. Based on the results of the research findings, the following air-cooling BTMS design tips are highlighted:
1.
At low inlet velocity (1–3 m/s), the ΔT is almost proportional to the distance between inlet and outlet, so a shorter cooling channel length (inlet to outlet distance) is preferred. The novel symmetrical double inlets/outlets structure effectively improved the thermal performance by reducing the airflow distance.
2.
The cooling performance improvement is not always proportional to the increase of the inlet air velocities. An optimal airflow rate is able to meet the basic requirement with the lowest power consumption. 2 m/s was selected as the optimal inlet velocity in this study to deliver a satisfying cooling performance with minimum power consumption.
3.
With the help of high-fidelity numerical simulations, the optimal degree of synergy between velocity field and temperature gradient field could be obtained by exhaustive orthogonal designs following the FSP. The cooling channel path of the symmetrical double inlets/outlets structure could strengthen the synergy degree with less design modifications.

Declaration of conflicting interests

The author(s) declared no potential conflicts of interest with respect to the research, authorship and/or publication of this article.

Funding

The author(s) disclosed receipt of the following financial support for the research, authorship and/or publication of this article: This work was supported by the Australian Research Council (grant number LP170100879).

ORCID iDs

References

1. Zhao G, Wang X, Negnevitsky M,. et al. Performance improvement of a novel trapezoid air-cooling battery thermal management system for electric vehicles. Sustainability 2022; 14: 4975.
2. Tang L, Fan B, Li C,. et al. Empirical evaluation of the environmental emergency management capability of local governments in China. Sustainability 2022; 14: 6760.
3. Senthilraja S, Ravichandran P, Gangadevi R. Influence of temperature and volume fraction on the thermophysical properties of CuO-R134a nano refrigerant and its application in battery thermal management system. Proceedings of the Institution of Mechanical Engineers, Part E: Journal of Process Mechanical Engineering 2021; 235: 660–669.
4. Zhao G, Wang X, Negnevitsky M. Connecting battery technologies for electric vehicles from battery materials to management. iScience 2022; 25: 103744.
5. Günther N, Griese M, Stammen E,. et al. Consideration of manufacturing induced adhesive damage in automotive simulations. Proceedings of the Institution of Mechanical Engineers, Part E: Journal of Process Mechanical Engineering 2022: 09544089221080087.
6. Zhao G, Wang X, Negnevitsky M,. et al. A review of air-cooling battery thermal management systems for electric and hybrid electric vehicles. J Power Sources 2021; 501: 230001.
7. Han X, Lu L, Zheng Y,. et al. A review on the key issues of the lithium ion battery degradation among the whole life cycle. ETransportation 2019; 1: 100005.
8. Pesaran AA. Battery thermal management in EV and HEVs: issues and solutions. Battery Man 2001; 43: 34–49.
9. Fan L, Khodadadi JM, Pesaran AA. A parametric study on thermal management of an air-cooled lithium-ion battery module for plug-in hybrid electric vehicles. J Power Sources 2013; 238: 301–312.
10. Zhao G, Wang X, Negnevitsky M. A study of variable cell spacings to the heat transfer efficiency of air-cooling battery thermal management system. Appl Sci 2021; 11: 11155.
11. Lu Z, Meng XZ, Wei LC,. et al. Thermal management of densely-packed EV battery with forced air cooling strategies. Energy Procedia 2016; 88: 682–688.
12. Chen K, Wang S, Song M,. et al. Configuration optimization of battery pack in parallel air-cooled battery thermal management system using an optimization strategy. Appl Therm Eng 2017; 123: 177–186.
13. Jiaqiang E, Yue M, Chen J,. et al. Effects of the different air cooling strategies on cooling performance of a lithium-ion battery module with baffle. Appl Therm Eng 2018; 144: 231–241.
14. Wang Y-W, Jiang J-M, Chung Y-H,. et al. Forced-air cooling system for large-scale lithium-ion battery modules during charge and discharge processes. J Therm Anal Calorim 2019; 135: 2891–2901.
15. Chen K, Chen Y, She Y,. et al. Construction of effective symmetrical air-cooled system for battery thermal management. Appl Therm Eng 2020; 166: 114679.
16. Yao L, Liang F, Jin J,. et al. Improved electrochemical property of ni-rich LiNi0. 6Co0. 2Mn0. 2O2 cathode via in-situ ZrO2 coating for high energy density lithium ion batteries. Chem Eng J 2020; 389: 124403.
17. Wang H, He F, Ma L. Experimental and modeling study of controller-based thermal management of battery modules under dynamic loads. Int J Heat Mass Transfer 2016; 103: 154–164.
18. Huo Y, Rao Z. The numerical investigation of nanofluid based cylinder battery thermal management using lattice Boltzmann method. Int J Heat Mass Transfer 2015; 91: 374–384.
19. Zhang Y, Song X, Ma C,. et al. Effects of the structure arrangement and spacing on the thermal characteristics of li-ion battery pack at various discharge rates. Appl Therm Eng 2020; 165: 114610.
20. Panchal S, Dincer I, Agelin-Chaab M,. et al. Transient electrochemical heat transfer modeling and experimental validation of a large sized LiFePO4/graphite battery. Int J Heat Mass Transfer 2017; 109: 1239–1251.
21. Chen Q, Ren J, Guo Z. Field synergy analysis and optimization of decontamination ventilation designs. Int J Heat Mass Transfer 2008; 51: 873–881.
22. Tao W-Q, He Y-L, Chen L. A comprehensive review and comparison on heatline concept and field synergy principle. Int J Heat Mass Transfer 2019; 135: 436–459.
23. Tiedemann W, Newman J. Mathematical modeling of the lead-acid cell. Proceedings of the Symposium on Battery Design and Optimization 1979: The Electrochemical Society Princeton and NJ, pp. 79-1.
24. Lee K-J, Smith K, Pesaran A,. et al. Three dimensional thermal-, electrical-, and electrochemical-coupled model for cylindrical wound large format lithium-ion batteries. J Power Sources 2013; 241: 20–32.
25. Chen M, Rincon-Mora GA. Accurate electrical battery model capable of predicting runtime and IV performance. IEEE Trans Energy Convers 2006; 21: 504–511.
26. Liao Z, Zhang S, Li K,. et al. A survey of methods for monitoring and detecting thermal runaway of lithium-ion batteries. J Power Sources 2019; 436: 226879.
27. Kim J, Oh J, Lee H. Review on battery thermal management system for electric vehicles. Appl Therm Eng 2019; 149: 192–212.
28. Pesaran AA. Battery thermal models for hybrid vehicle simulations. J Power Sources 2002; 110: 377–382.
29. Yang S, Ling C, Fan Y,. et al. A review of lithium-ion battery thermal management system strategies and the evaluate criteria. Int J Electrochem Sci 2019; 14: 6077–6107.
30. Choi C, Kang D, Shin W,. et al. Research on development of a thermal analysis model based on electrical characteristics experiment of high capacity 21700 Lithium-Ion battery. In: Proceedings of the KIPE Conference 2020, pp.40–42: The Korean Institute of Power Electronics.
31. Fan Y, Bao Y, Ling C,. et al. Experimental study on the thermal management performance of air cooling for high energy density cylindrical lithium-ion batteries. Appl Therm Eng 2019; 155: 96–109.
32. Li M, Feng M, Luo D,. et al. Fast charging li-ion batteries for a new era of electric vehicles. Cell Reports Phys Sci 2020; 1: 100212.

Supplementary Material

Please find the following supplemental material available below.

For Open Access articles published under a Creative Commons License, all supplemental material carries the same license as the article it is associated with.

For non-Open Access articles published, all supplemental material carries a non-exclusive license, and permission requests for re-use of supplemental material or any part of supplemental material shall be sent directly to the copyright owner as specified in the copyright notice associated with the article.