

Future Optimism and Subjective Well-Being Across Societies: Reciprocal Links and the Role of Cultural Flexibility–Monumentalism
Abstract
Introduction
Literature Review and Research Hypotheses
Future Optimism and Subjective Well-Being
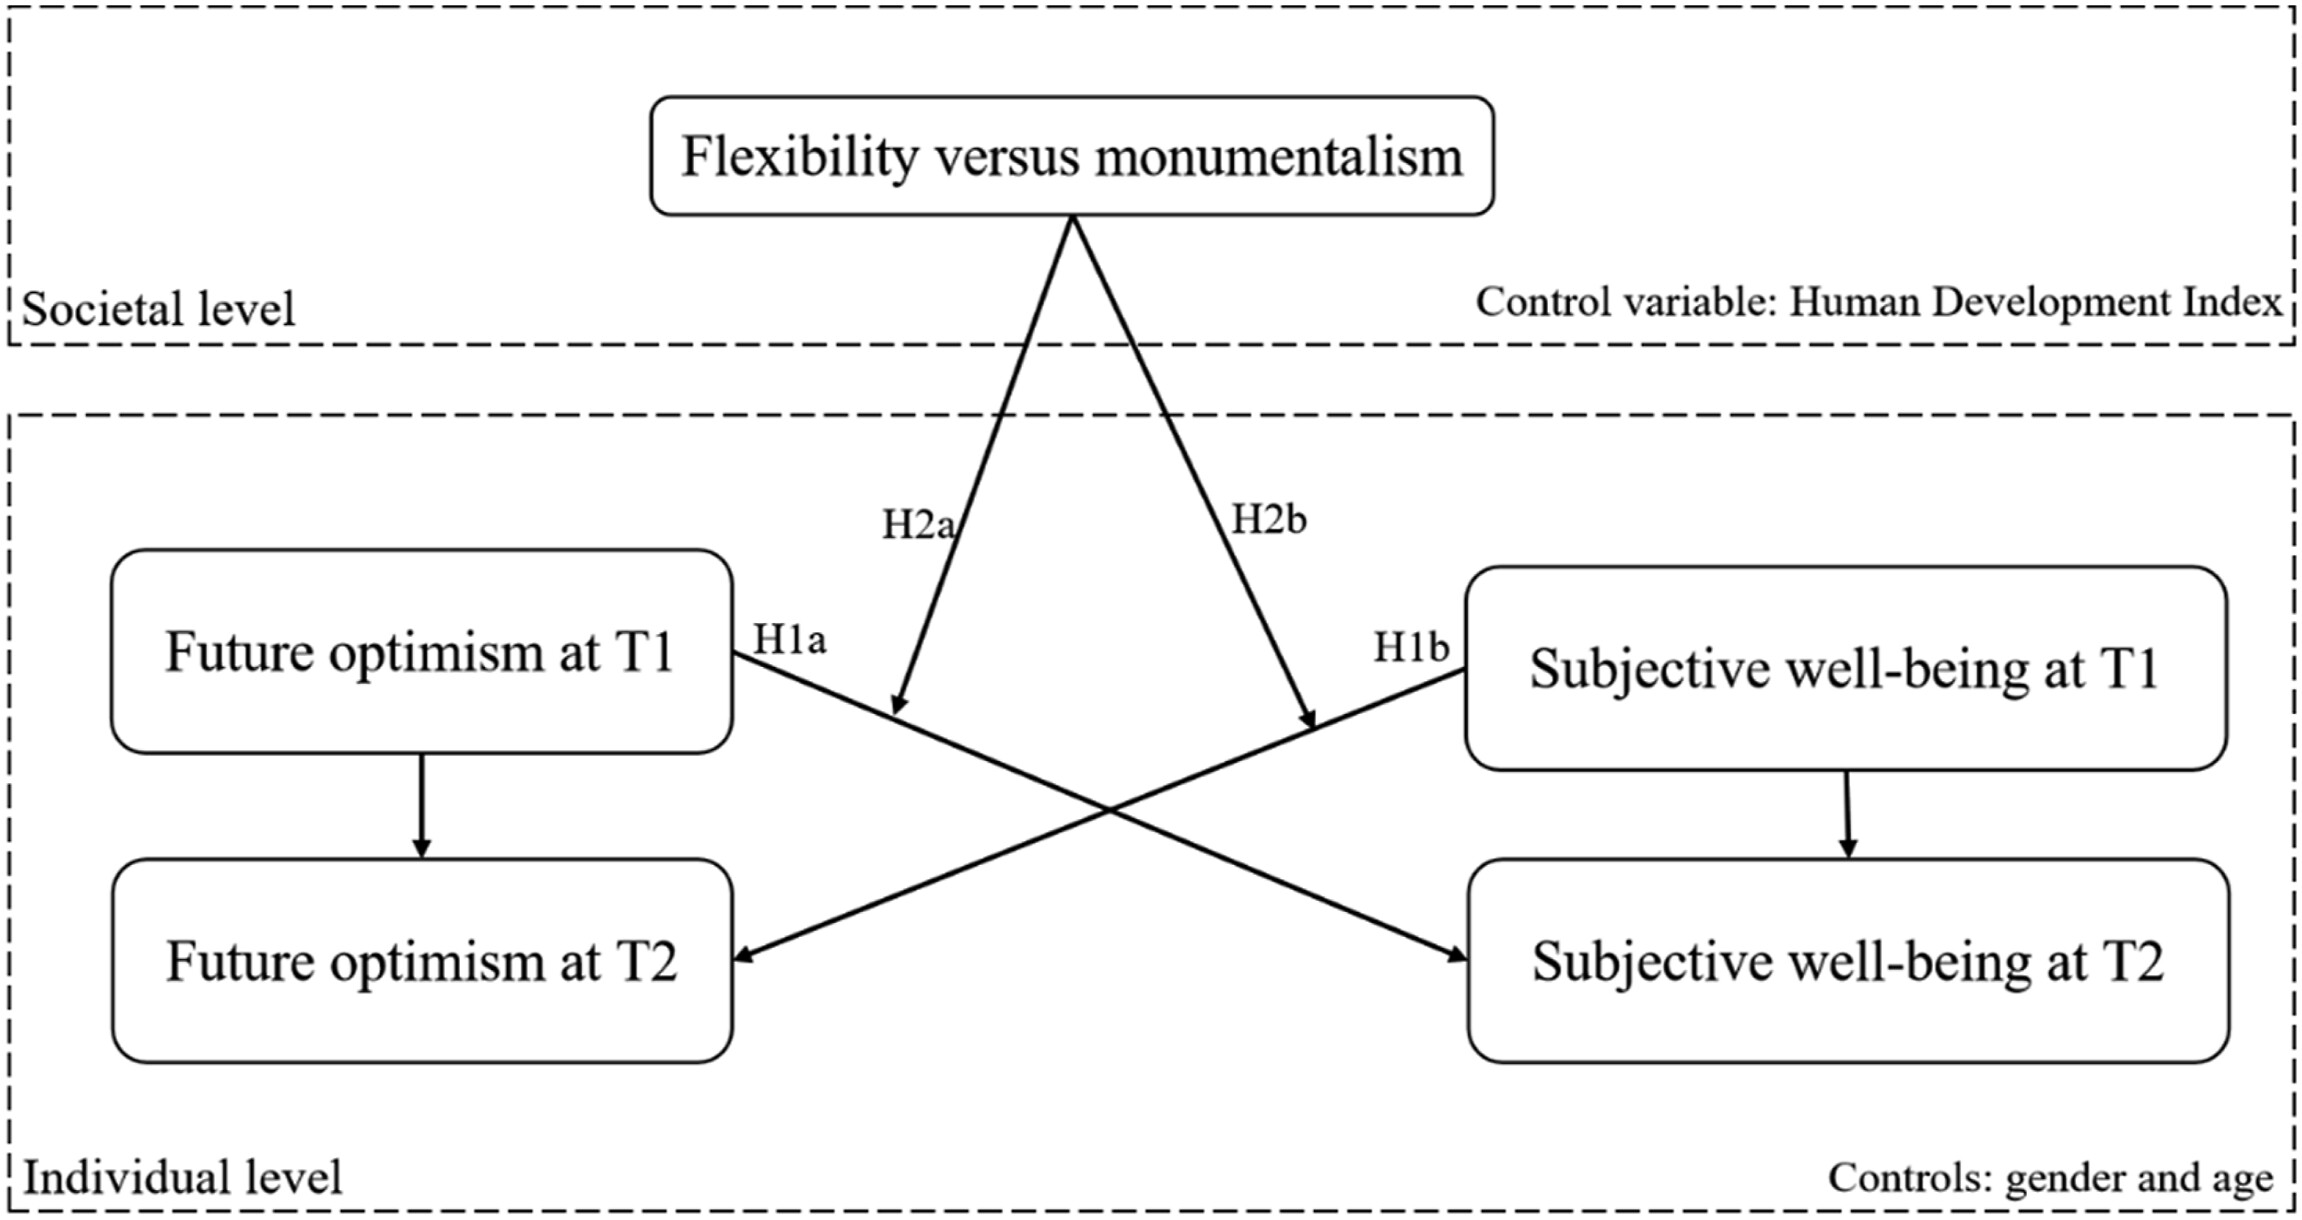
The Moderating Role of Flexibility–Monumentalism
The Current Study
Methods
Data
Measures
Subjective Well-Being
Future Optimism
Demographics
Flexibility–Monumentalism (FLX-MON)
Human Development Index (HDI)
Analytical Strategy
Data Cleaning
Results
Descriptive Statistics and Preliminary Analyses
Main Model Results
| Dependent variable | SWB at T2 | Future optimism at T2 |
|---|---|---|
| Individual-level coefficient | ||
| Future optimism at T1 | 0.036 | 0.307*** |
| (0.020) | (0.003) | |
| SWB at T1 | 0.576*** | 0.291*** |
| (0.003) | (0.042) | |
| Gender | 0.027*** | −0.015 |
| (0.007) | (0.011) | |
| Age at T1 | 0.002*** | −0.003*** |
| (0.0002) | (0.0003) | |
| Akaike’s information criterion | 244,601.2 | 418,665.2 |
| Dependent variable | SWB at T2 | Future optimism at T2 |
|---|---|---|
| Individual-level coefficient | ||
| Future optimism at T1 | 0.036* | 0.307*** |
| (0.017) | (0.003) | |
| SWB at T1 | 0.576*** | 0.290*** |
| (0.003) | (0.033) | |
| Gender | 0.027*** | −0.015 |
| (0.007) | (0.011) | |
| Age at T1 | 0.002*** | −0.003*** |
| (0.0002) | (0.0003) | |
| Society-level coefficient | ||
| FLX-MON | −0.133 | −0.563 |
| (0.280) | (0.318) | |
| HDI | 1.224** | 1.312** |
| (0.388) | (0.444) | |
| Cross-level interaction item coefficient | ||
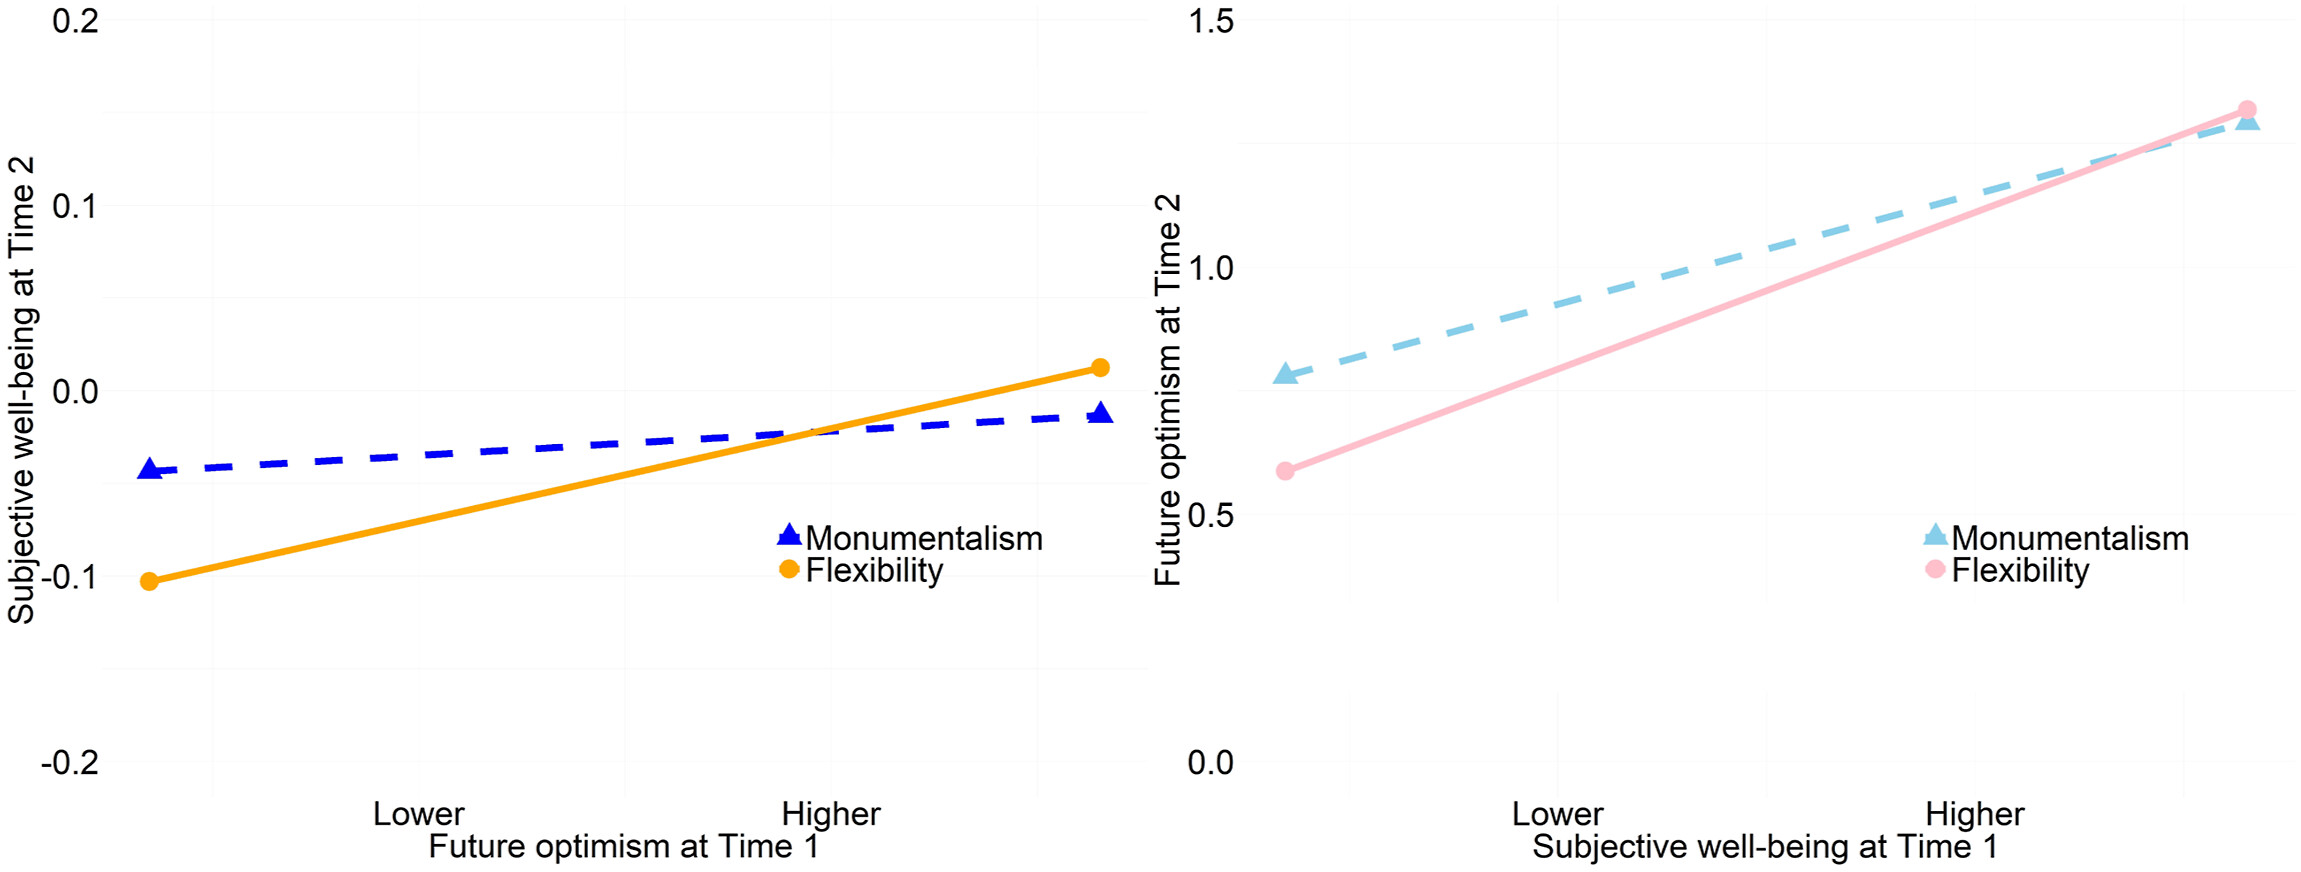
| Future optimism at T1 × FLX-MON | 0.215** | |
| (0.074) | ||
| SWB at T1 × FLX-MON | 0.549*** | |
| (0.141) | ||
| Akaike’s information criterion | 418,661.1 | 520,741.6 |
Discussion
General Discussion
Theoretical Implications
Practical Implications
Limitations and Future Directions
Conclusion
Acknowledgements
Ethical Considerations
Declaration of Conflicting Interests
Funding
ORCID iDs
Footnote
Data availability statement
References
Appendix
Abbreviations
- GFS
- Global flourishing study
- HDI
- Human development index
- ICC
- Intraclass correlation coefficient
- FLX-MON
- Flexibility–Monumentalism
- SWB
- Subjective well-being
- T1
- Time 1
- T2
- Time 2.
Biographies
Supplementary Material
Please find the following supplemental material available below.
For Open Access articles published under a Creative Commons License, all supplemental material carries the same license as the article it is associated with.
For non-Open Access articles published, all supplemental material carries a non-exclusive license, and permission requests for re-use of supplemental material or any part of supplemental material shall be sent directly to the copyright owner as specified in the copyright notice associated with the article.
Cite
Cite
Cite
Download to reference manager
If you have citation software installed, you can download citation data to the citation manager of your choice
Information, rights and permissions
Information
Published In
Keywords
Rights and permissions
Data availability statement
Authors
Metrics and citations
Metrics
Publication usage*
Total views and downloads: 272
*Publication usage tracking started in December 2016
Publications citing this one
Receive email alerts when this publication is cited
Web of Science: 0
Crossref:
There are no citing articles to show.
Figures and tables
Figures & Media
Tables
View Options
View options
PDF/EPUB
View PDF/EPUBAccess options
If you have access to journal content via a personal subscription, university, library, employer or society, select from the options below:
I am signed in as:
View my profileSign out

I can access personal subscriptions, purchases, paired institutional access and free tools such as favourite journals, email alerts and saved searches.
loading institutional access options
Alternatively, view purchase options below:
Purchase 24 hour online access to view and download content.
Access journal content via a DeepDyve subscription or find out more about this option.
