Introduction
Approximately 13 million low-income older adults and people with a disability or qualifying medical condition are dually eligible for and enrolled in Medicare and Medicaid. Medicare and Medicaid each cover different services for dual-eligible beneficiaries, and for most, the programs are not coordinated (
Grabowski, 2007;
Peña et al., 2024). Medicare, a federal program, is the primary payer for prescription drugs and inpatient, outpatient, and post-acute care. Medicaid, which is managed by states with joint federal-state funding, covers Medicare out-of-pocket costs and, for 9 million individuals with full Medicaid, it also provides coverage for long-term care and additional behavioral health services (Medicare Payment Advisory Commission &
Medicaid and CHIP Payment and Access Commission, 2024).
The bifurcated nature of Medicare and Medicaid poses numerous administrative and caregiving challenges (
Bella et al., 2024). For example, beneficiaries must navigate different eligibility pathways for Medicare and Medicaid (
Feng et al., 2019a;
Johnston et al., 2024). Eligibility for Medicare is based on age, presence of a qualifying disability, or end-stage renal disease. Once individuals enroll in Medicare, most remain continuously covered while alive. Conversely, Medicaid eligibility is based on income and assets, and most beneficiaries must complete an annual eligibility redetermination (
Burns et al., 2024). Administrative complexity and the lack of a coordinated process for managing Medicaid renewals may contribute to low enrollment and result in individuals cycling on and off Medicaid, termed “churn” (
Feng et al., 2019b;
Lakhmani et al., 2022;
Tjhia et al., 2024). Prior studies estimated that as many as one-half of Medicare beneficiaries who qualified for Medicaid did not enroll and that 7% to 8% of dual-eligible beneficiaries disenrolled from Medicaid annually (
Ma et al., 2024;
Pezzin & Kasper, 2002;
Riley et al., 2014). Of those who disenrolled, approximately one-half regained Medicaid within 12 months (
Ma et al., 2024). Furthermore, beneficiaries and caregivers often have trouble navigating services covered by separate programs (e.g., Medicare-funded post-acute care and Medicaid-funded long-term care), and few administrative or financial levers exist to support care coordination (
Grabowski, 2007).
To address these challenges, policymakers are prioritizing efforts to expand integrated care plans (ICPs) (
Bella et al., 2024;
Medicare Payment Advisory Commission, 2019;
Velasquez et al., 2023). ICPs are models in which one entity—typically a managed care plan—manages Medicare and Medicaid benefits and spending for dual-eligible beneficiaries. To date, policymakers have had experience with three major categories of ICPs: (1) Medicare-Medicaid Plans (tested under the Financial Alignment Demonstration of the Centers for Medicare and Medicaid Services), (2) Fully Integrated Managed Dual Eligible Special Needs Plans (a category of Medicare Advantage Dual Eligible Special Needs Plans), and (3) Programs of All-Inclusive Care for the Elderly (for older adults needing nursing home-level care) (
Medicaid and CHIP Payment and Access Commission, 2022a;
Medicaid and CHIP Payment and Access Commission, 2022b;
Roberts et al., 2024). ICPs primarily enroll dual-eligible beneficiaries with full Medicaid, reflecting this population’s need for coordinated Medicare and Medicaid services (
Bella et al., 2024). Although ICPs have different financial and organizational characteristics, common goals are to coordinate services within one entity that bears risk for Medicare and Medicaid spending, reduce costly hospital and nursing home use, and expand access to community-based services and supports. ICPs may also simplify how beneficiaries access Medicare and Medicaid benefits by providing a single point of contact to coordinate coverage (
Greene, 2017;
Medicaid and CHIP Payment and Access Commission, 2021;
Mellor et al., 2024).
Conceptually, there are several ways ICPs might affect low-income Medicare beneficiaries’ enrollment in and retention of Medicaid. First, ICPs have incentives to reduce Medicaid churn because the plans can only enroll dual-eligible beneficiaries and are paid on a capitated basis (i.e., a risk-adjusted amount per enrollee-month) (
Medicare Payment Advisory Commission, 2018). Reducing churn helps ICPs attain a predictable revenue stream and maintain a sufficient enrollment base to pool risks. It may also mitigate adverse selection by reducing the likelihood that Medicaid enrollment is concentrated during costly care episodes—a pattern observed in prior research, which found that Medicare beneficiaries are more likely to enroll in Medicaid during periods of expensive hospital or nursing facility care (
Garrow et al., 2023;
Keohane et al., 2017;
Spillman & Waidmann, 2014). Second, helping individuals retain Medicaid can enable ICPs to provide ongoing care management and supportive services, such as Medicaid home- and community-based services, for people with long-term care needs. Providing these services continuously could avert the need for costly downstream care associated with unmet need, such as hospitalizations (
Allen et al., 2014;
Wolff et al., 2019), and MMPs could capture the resulting savings if they expect to retain enrollees over time. Third, by coordinating coverage within a single plan, MMPs may be able to reduce the administrative burden of Medicaid renewals. For example, MMPs can notify enrollees about upcoming Medicaid renewals, assist with renewal paperwork, and serve as a central point of contact to address coverage questions (
Lakhmani et al., 2022).
Evaluating whether ICPs increase Medicaid enrollment and reduce churn is important for several reasons. First, it can illuminate whether ICPs are effective in helping individuals navigate administrative hurdles to obtaining or keeping Medicaid. This is especially relevant for individuals from socially disadvantaged populations, who often face challenges navigating health insurance (
Kyle & Frakt, 2021;
Office of Management and Budget, 2021). Second, it can shed light on whether ICPs may be effective in helping enrollees maintain Medicaid coverage that provides access to long-term services and supports. Third, it can help policymakers better anticipate the costs of expanding ICPs, as has been envisioned in recent legislative proposals (
Sen Cassidy, 2024). For example, Medicaid costs could rise if there is an increase in Medicaid-covered months, and capitation payments to ICPs, that are not offset by efficiencies in how ICPs manage care. Cost impacts also depend on whether marginal enrollees—those taking up Medicaid due to ICP expansions—have different costs from existing Medicaid enrollees. However, empirical evidence about the impacts of ICPs on these margins remains limited.
Policy Context
Medicare-Medicaid Plans (MMPs) are financially integrated managed care plans for dual-eligible beneficiaries. The plans were implemented in 10 states as part of the Medicare-Medicaid Financial Alignment Initiative (FAI), a program of the Innovation Center at CMS and the Medicare-Medicaid Coordination Office that tested integrated models for dual-eligible beneficiaries (
Medicare Payment Advisory Commission, 2018). In addition to MMPs, the FAI tested managed fee-for-service models in Colorado and Washington, which we did not study. States tested MMPs for different periods. For example, Virginia’s MMP model operated from April 2014 to December 2017 and California’s ran from April 2014 to December 2022. Other states continued their programs through 2025, when all remaining MMPs are scheduled to end.
MMPs received pooled capitation payments covering all Medicare- and Medicaid-funded services for dual-eligible beneficiaries (
Centers for Medicare and Medicaid Services, 2019). In all states, enrollment was limited to dual-eligible beneficiaries with full Medicaid who lived in counties that were part of states’ MMP demonstration areas. Some states further limited enrollment to specific beneficiary subpopulations based on characteristics such as age (e.g., Massachusetts and South Carolina) or specific needs, such as long-term care or presence of an intellectual or developmental disability (e.g., New York).
Enrollment in MMPs was voluntary. States and plans used a combination of active enrollment (e.g., marketing and recruitment of beneficiaries) and passive enrollment, wherein individuals residing in MMP demonstration areas were automatically enrolled in the plans but could opt out at any point (
Medicare Payment Advisory Commission, 2016). Due to varying opt-out rates, participation in the MMPs differed across states, from 62% in Ohio to 5% in New York (
Grabowski et al., 2017).
Table 1 summarizes the geographic scope, implementation dates, eligible populations, and enrollment in MMPs by state. MMPs were offered in seven and six large metropolitan counties in California and Texas, respectively. In Illinois, Michigan, and Ohio, MMPs were offered in approximately 20% to 30% of counties, including most major cities. MMPs were offered in 77% of counties in Virginia, and all or almost all counties in Massachusetts, Rhode Island, and South Carolina. In all but three states, MMPs served all dual-eligible beneficiaries regardless of age or health condition. In Massachusetts, enrollment was limited to beneficiaries under age 65; in South Carolina, enrollment was limited to those ages 65 and older (
Barnette, 2021). In New York, which had the fewest enrollees, two MMPs served dual-eligible individuals needing nursing facility-level care and people with intellectual and developmental disabilities (
Centers for Medicare and Medicaid Services, n.d.-a).
Our analysis focused on MMPs in nine states: California, Illinois, Massachusetts, Michigan, Ohio, Rhode Island, South Carolina, Texas, and Virginia. We did not include New York in the intervention group due to the small scale of its MMPs.
Method
Data and Sample
Our primary data source was the Medicare Master Beneficiary Summary File (MBSF), which we analyzed for a 20% random sample of Medicare beneficiaries from 2010 to 2019. We used the MBSF to measure beneficiary demographics (age, race and ethnicity, and sex), original reason for Medicare entitlement (age, disability, or end-stage renal disease), geography (state, county, and zip code), and monthly Medicaid enrollment. We used FAI reports on the CMS website to identify the dates of MMP rollouts and the counties where these plans operated.
As the MBSF only reports Medicaid
enrollment but not eligibility, we used residence in a high-poverty zip code, defined as the highest quintile of poverty among people aged 65 and older (based on 5-year averages from the 2019 American Community Survey), to identify areas where low-income Medicare beneficiaries were most likely to live. This approach aligns with other recent research (
Bundorf et al., 2024). To isolate changes in Medicaid take-up unrelated to Medicare coverage (e.g., Medicaid eligibility changes when people age into Medicare), we further limited the sample to people with at least 2 years Medicare coverage prior to the analysis year. We included person-month data on Medicaid enrollment in the 36 months before and 36 months after MMP implementation and contemporaneous periods in comparison groups (see
Supplemental Appendix Figure 1 for a sample inclusion flow diagram). We confirmed that MMP enrollment among dual-eligible beneficiaries tracked state-specific rollout dates for these plans (
Supplemental Appendix Figure 2).
Study Design and Treatment and Comparison Groups
We used a difference-in-differences (DID) design to assess whether the introduction of MMPs was associated with increased Medicaid enrollment and retention. We first estimated separate treatment effects for each MMP state and then aggregated treatment effects across states. All analyses followed an intention-to-treat approach, comparing beneficiaries who met our inclusion criteria and resided in MMP counties (treatment group) to those in non-MMP counties (comparison group).
We conducted complementary analyses using two sets of comparison groups. The first comparison group included beneficiaries living in states without MMPs that neighbored states with MMPs
(neighbor state comparisons). To control for potential spillovers of Affordable Care Act (ACA) Medicaid expansions, which targeted working-age adults
without Medicare, on Medicaid enrollment among individuals
with Medicare (
Bundorf et al., 2024;
McInerney et al., 2020), we matched treatment and comparison states on ACA Medicaid expansion status. Specifically, for each treatment state that expanded Medicaid, we selected comparison states that also expanded Medicaid within 1 year of the treatment state’s expansion date. We did not allow a state to contribute to the comparison group if it had an existing Medicare-Medicaid integration program (e.g., Minnesota Senior Health Options Program or Wisconsin Partnership Program) (
Medicare Payment Advisory Commission, 2018) or enacted a change in Medicaid eligibility for older adult or disabled populations around the time of MMP implementation (e.g., as happened in Indiana in 2014) (
Cornelio, 2023). Analyses using neighbor state comparisons included eight MMP states and 18 comparison states; Michigan was excluded due to the lack of suitable neighbor state comparisons. To account for age restrictions on MMP eligibility in certain states, analyses of Massachusetts and its comparison states were limited to beneficiaries under age 65, and analyses of South Carolina and its comparison states were limited to beneficiaries over age 65.
The second comparison group included Medicare beneficiaries who lived in counties without MMP availability within states that established MMPs
(within-state comparisons). This analysis included six states. Massachusetts, Rhode Island, and South Carolina were excluded because their MMP programs were statewide or near statewide. Treatment regions and both sets of comparison regions are mapped in
Supplemental Appendix Figure 3.
Ohio made several changes to its Medicaid eligibility rules for older adults and disabled individuals 27 months after MMP rollout, resulting in an increase in Medicaid enrollment (
Cornelio, 2023). To exclude the effects of this eligibility shift from our analyses, we restricted the Ohio post-period to 24 months in both the neighbor-state and within-state models.
Outcomes
Our primary outcome was enrollment in full Medicaid, which we measured at the person-month-level in the MBSF. The denominator included person-months while an individual was alive and enrolled in Medicare in the study year. As a secondary outcome, we analyzed continuous enrollment in full Medicaid while alive (measured at the person-year level).
Difference-in-Differences Models
We analyzed a 36-month window centered on MMP rollout. To account for heterogeneity across states, we first constructed state-specific estimates by fitting a separate DID model for each MMP state. For analyses using neighbor state comparisons, we estimated person-month-level linear models of the form:
where yict is a binary indicator of Medicaid enrollment for beneficiary i in county c and month t; Postt is an indicator of month t occurring on or after MMP rollout; and Trtc identifies treatment counties (i.e., whether an MMP was ever implemented in county c in the study window). We controlled for beneficiary demographics, denoted Xi, (age, sex, race and ethnicity, and original reason for Medicare entitlement) and county and calendar year fixed effects, denoted and , respectively. The county fixed effects subsume the main effect of . Because counties are nested within states, the county fixed effects also account for time-invariant state-level factors, such as state-specific Medicaid eligibility and renewal policies. The coefficient of interest, , captures the differential change in Medicaid enrollment before and after MMP rollout among low-income Medicare beneficiaries residing in counties with MMPs compared with beneficiaries in nearby regions without MMPs. We used a similar model to estimate state-specific treatment effects using within-state comparisons.
Next, we used a stacked DID model to pool these state-specific estimates into an overall estimate. In this specification, each set of treated and comparison counties that contribute to a state-specific estimate is analyzed as a sub-experiment (or “stack”), and treatment effects are aggregated across sub-experiments to yield a pooled estimate. This allowed us to obtain a pooled estimate accounting for the staggered timing of MMP rollouts across states. For analyses using neighbor state comparisons, this model had the form:
We included county-by-stack fixed effects to account for counties potentially serving as comparisons across multiple sub-experiments and year-by-stack fixed effects () to control for time trends by sub-experiment. The coefficient is the pooled DID estimate. Finally, to obtain a pooled estimate for the analyses using within-state comparison counties, we ran the models:
Here, each sub-experiment includes counties within the same state. We include state-by-year fixed effects to control for time trends common to treatment and comparison counties within the same state.
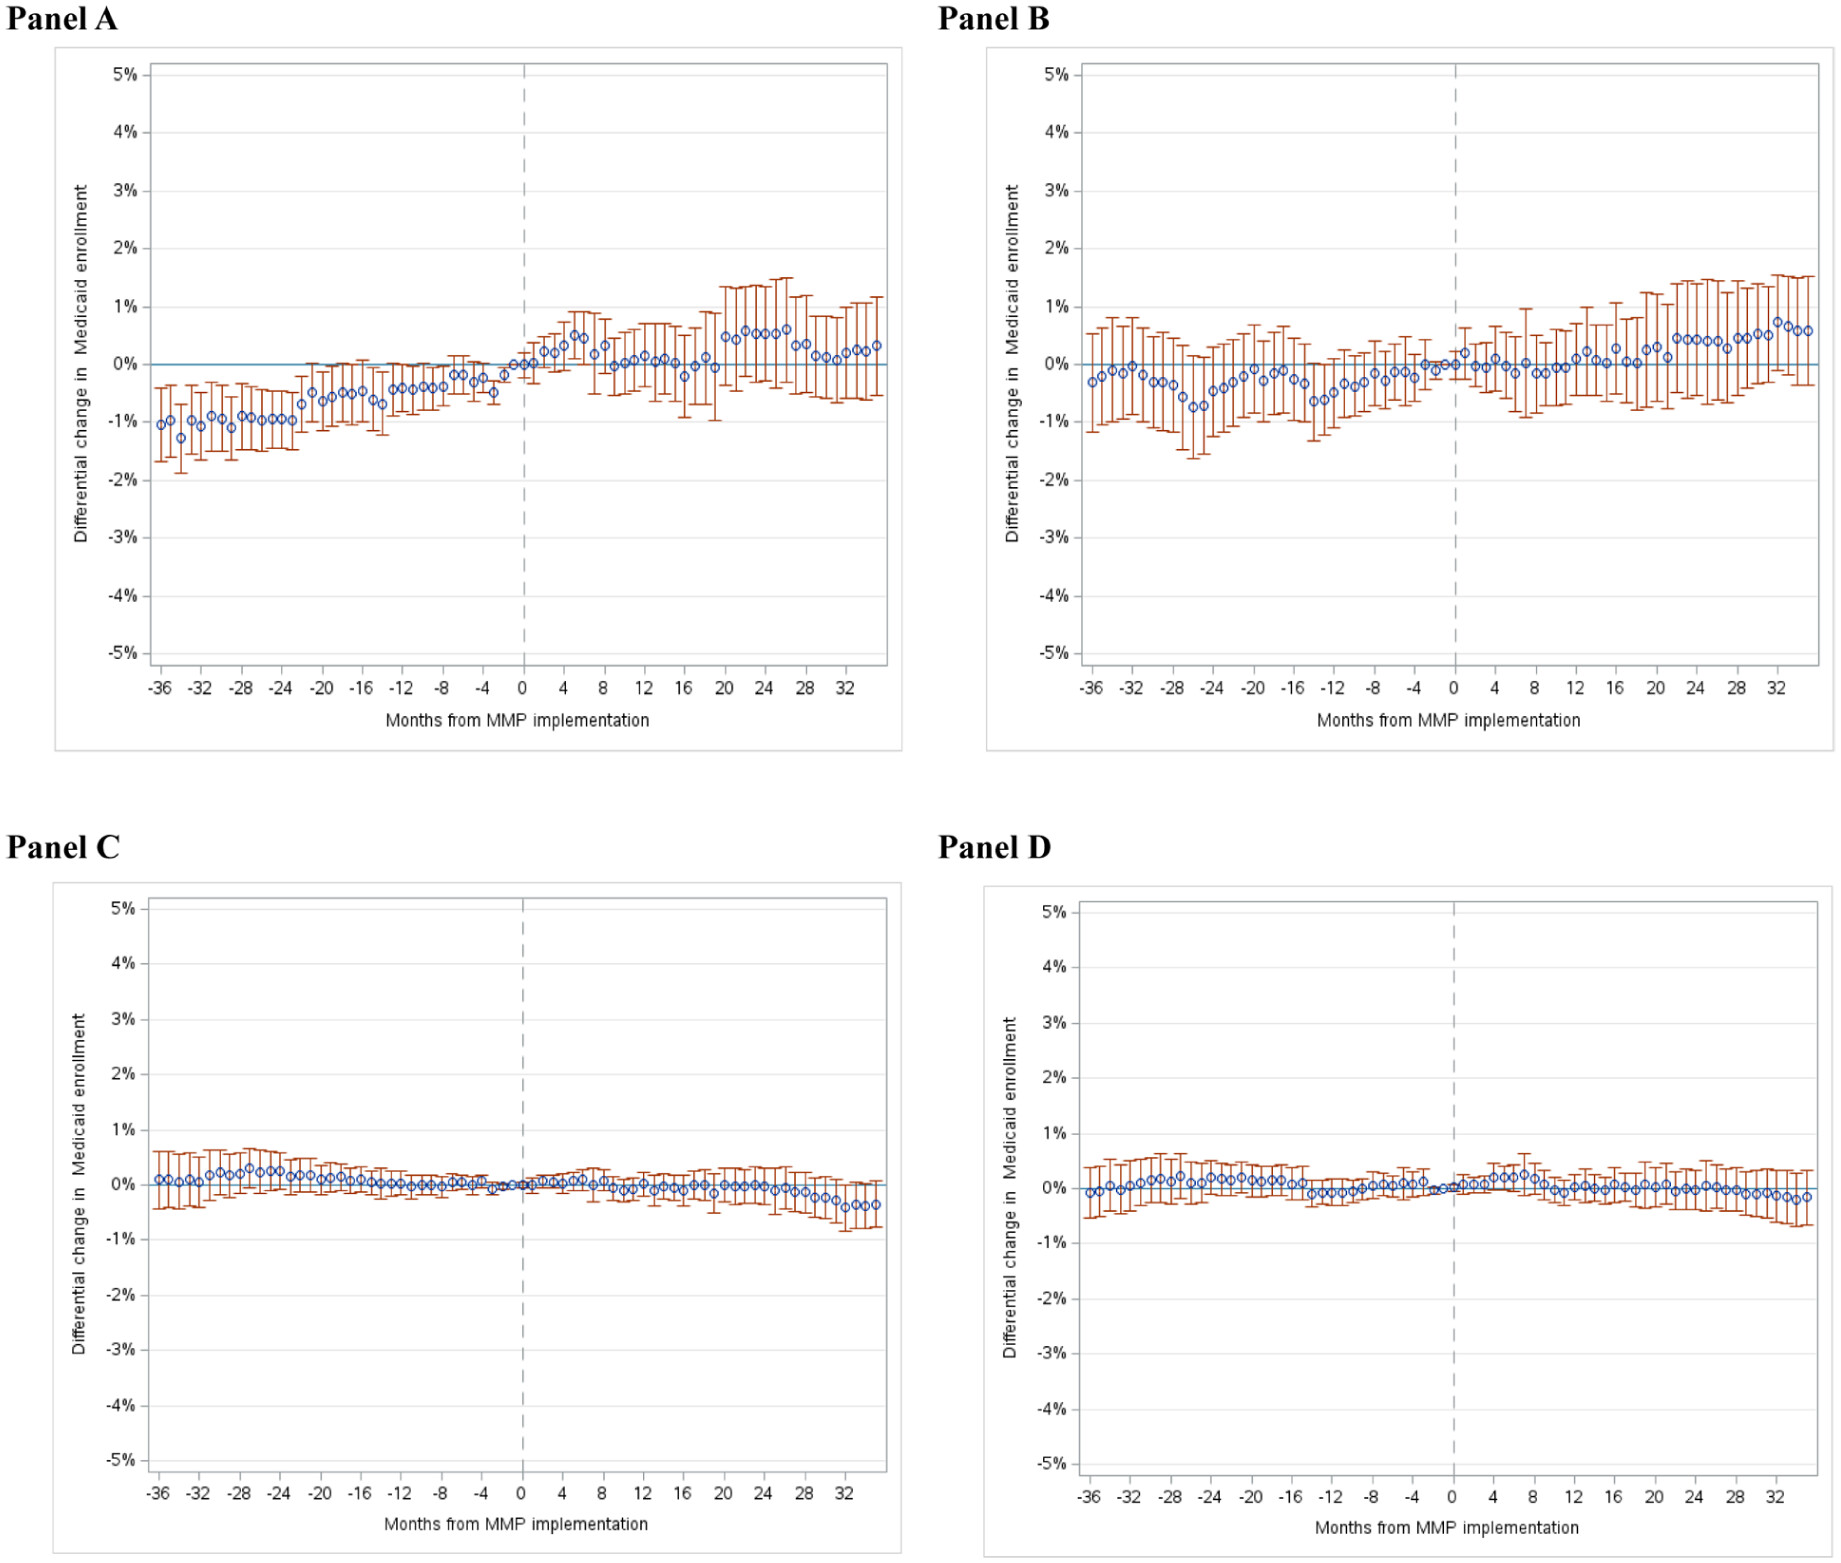
DID assumes that time-varying factors unrelated to MMPs had similar effects on the treatment and comparison groups, making changes in the comparison group a plausible counterfactual for changes that would have been expected in the treatment group without the MMPs. To evaluate this assumption, we fitted event-study models to test for common (i.e., parallel) outcome trends in the pre-MMP period across treatment and comparison groups. Any evidence of differential pre-trends suggests that this DID assumption may not hold, underscoring a need for caution in interpreting estimates as causal effects of MMP implementation. In addition, to summarize baseline trend differences between the treatment and comparison groups, we fit a model on baseline data that included a linear time trend, treatment group indicator, and their interaction; the interaction captures the difference in outcome trends between groups before MMP implementation.
Age Stratification
To account for differences between the older adult and disabled Medicare populations, we conducted stratified analyses for Medicare beneficiaries under age 65 versus age 65 and over. Because we restricted our sample to beneficiaries with at least 2 years of prior Medicare coverage, the second age stratum consisted of beneficiaries ages 67 and older. For simplicity, we refer to this second group as age 65 or older.
Supplementary Analyses
We conducted four supplementary analyses. First, to examine the effects of MMP rollout on Medicaid retention, we analyzed continuous 12-month enrollment in full Medicaid while beneficiaries were alive. We indexed beneficiary-years relative to the month of MMP implementation. Because our measure of continuous enrollment could span two calendar years, we used the enhanced 5% Medicare sample, which maintains a consistent longitudinal sample. Second, we used the user-written Stata package HonestDiD to assess the sensitivity of our DID estimates to violations of the parallel trend assumption (
Bravo et al., 2024;
Rambachan & Roth, 2023). HonestDiD calculates confidence bounds for DID estimates under possible violations of the parallel trends assumption; these violations are modeled by varying the degree to which any differential pre-trends were assumed to continue post-MMP implementation. Third, we restricted our treatment sample to beneficiaries who resided in counties with MMP participation rates above the state-level median among demonstration counties (during the post-implementation period), as we expect any effect of the MMPs on Medicaid take-up to be concentrated in these counties. Fourth, we examined heterogeneity in the effects of MMP rollout on Medicaid enrollment in age subgroups of older adult Medicare beneficiaries (i.e., those ages 65–69, 70–74, 75–79, vs. ≥80 years) and among those with ≥1 versus 0 hospital admissions in the prior year (assessed from the Medicare Provider Analysis and Review file). Differential Medicaid take-up across groups related to age or prior use of care could affect the costs of covering marginal Medicaid enrollees.
Discussion
This study examined whether the rollout of MMPs—one of the largest multi-state efforts to test ICPs—was associated with changes in Medicaid enrollment and retention among Medicare beneficiaries residing in communities with a high concentration of low-income older adults. Overall, we found no evidence that the rollout of MMPs led to increases in monthly Medicaid enrollment or continuous Medicaid coverage, relative to changes in comparison regions where MMPs were not implemented. Although analyses of some states and the under-65 population found a modest differential increase in Medicaid enrollment post-MMP implementation, these changes typically followed a trend of rising Medicaid enrollment preceding MMP implementation in treatment vs. comparison regions. Thus, it is unlikely that continued changes in Medicaid enrollment were the result of MMP implementation. We also found no evidence that Medicaid enrollment increased differentially in analyses of subpopulations expected to cost more due to age or prior health care use.
These findings suggest that the expansion of ICPs alone may not materially increase Medicaid enrollment rates. However, targeted policies that help Medicare beneficiaries maintain Medicaid enrollment could complement and enhance Medicare-Medicaid integration efforts. Disenrollment from Medicaid can erode opportunities to integrate coverage because loss of Medicaid—and thus dual-eligibility status—requires individuals to disenroll from ICPs. Reducing Medicaid churn can prevent these disruptions, preserving enrollee access to ICPs’ care coordinators and in-network providers. It also offers plans a more stable enrollee base, which could improve the financial viability of ICPs and incentivize long-term investments in care management, especially when plans expect to retain enrollees over time. Sable Medicaid enrollment also ensures that low-income Medicare beneficiaries receive cost-sharing assistance for medical services and maintain access to long-term care services, including and home- and community-based services.
To our knowledge, this is the first study to evaluate whether Medicaid enrollment is affected by policies designed to integrate coverage for dual-eligible beneficiaries. However, several recent studies have examined the effects of other policies on Medicaid take-up among low-income Medicare beneficiaries. For example, McInerny, Mellor, and Sabik used U.S. Census Bureau data to study the effects of ACA Medicaid expansions to working-age adults (ages 19–64 years) on Medicaid take-up among low-income adults ages 65 and older (
McInerney et al., 2020). They found that exposure to ACA Medicaid expansions among low-income adults approaching age 65 increased their likelihood of enrolling in Medicaid past 65 by approximately 2 percentage points. These effects were driven, in part, by pre-65 Medicaid coverage increasing the likelihood that individuals maintain Medicaid after aging into Medicare (termed an “on-ramp” effect). A more recent study using administrative data found that exposure to ACA Medicaid expansions before age 65 led to an even larger (9 percentage point) increase in Medicaid enrollment after individuals had entered Medicare (
Bundorf et al., 2024). Other analyses found that Medicaid enrollment among low-income Medicare beneficiaries was higher, and churn was lower, in states that automatically enrolled individuals receiving Supplemental Security Income in Medicaid (
Burns et al., 2012;
Cornelio, 2023;
Roberts et al., 2019). Together, these studies highlight how policies that simplify Medicaid enrollment and provide an on-ramp to Medicaid coverage (e.g., for individuals newly eligible for Medicare and Medicaid) can result in meaningful increases in Medicaid take-up.
Limitations
This study had several limitations. First, unmeasured time-varying factors at the county or beneficiary levels could have biased our DID estimates. To reduce bias, we matched treatment and comparison regions to account for concurrent effects of ACA Medicaid expansions. However, bias could still arise if the effects of ACA expansions or other time-dependent factors differed across treatment and comparison counties. Second, we could not directly identify Medicaid-eligible but unenrolled individuals. Instead, we used zip codes with high-poverty rates among older adults to identify a population with a higher likelihood of Medicaid eligibility. Third, our estimates rely on an intention-to-treat design that compares changes among beneficiaries in counties with MMPs—regardless of individual-level MMP enrollment—to those in comparison counties without MMPs. While this approach avoids bias from comparing voluntary enrollees to non-enrollees, it may dilute the estimated effect of MMPs on Medicaid enrollment by averaging outcomes across both groups. However, our findings were similar when we limited the analysis to counties with MMP penetration rates above the state median, where such attenuation bias would likely be smaller. Fourth, we focused on implementation of MMPs to capitalize on a natural experiment arising from state variation in the rollout of these programs. However, MMPs are temporary demonstration plans, which are scheduled to conclude in 2025, and our findings may not generalize to other, ongoing categories of ICPs.