Introduction
For many years, literacy researchers working across a variety of settings and from diverse theoretical orientations have demonstrated how starting from space, movement, and affect presents an expanded set of possibilities to conceptualize early childhood literacy. For example, early work by
Rowe (2008) and
Leander (2002) used multimodal transcripts to demonstrate how the positioning of artifacts and embodied movements of students and teachers contributes to the social construction of writing events and identity in classrooms. Others such as
Whittingham (2019) extend these ideas and methods such as geosemiotics (
Scollon and Scollon, 2003) to further illustrate how a spatial perspective is critical to understand how power is socially produced across classroom lessons and how teachers use physical classroom spaces. Still others have turned to sociomaterial (e.g.,
Kervin et al., 2017), new materialist (e.g.,
Barad, 2007;
Wohlwend et al., 2017) and posthuman perspectives (e.g.,
Sheridan et al., 2020) to characterize the entanglement of movement between human, nonhuman, and more-than-humans central to young children’s learning in and across classrooms, museums, and other settings including the natural world (e.g.,
Daniels, 2019;
Ehret and Hollett, 2014;
Hackett, 2022;
Kuby and Rowsell, 2017;
Leander and Boldt, 2013;
Marin et al., 2020).
These efforts continue to emphasize the need for alternative methods to enliven the spatial and affective experiences of people and things represented in data used for interpretive analysis and to conceptualize experiences such as joy (
Nordstrom and Kumpulainen, 2021), animacy (
MacRae et al., 2018), and vitality (
Silvis, 2019) that are at the heart of learning and literacy. In particular, this work illustrates the value of literacy methods that expand how analysts metaphorically animate data (i.e., bring attention to or highlight key facets) and how researchers can literally produce animations of and with data. Such methods are crucial not only to support traditional forms of analysis but also, as
Ellingson and Sotirin (2020) aptly describe, to explore new possibilities to engage and make with data.
Building on this work, this article examines how a methodological approach we have developed called
interaction geography provides alternative ways to animate space, movement, and affect for literacy researchers working from diverse theoretical orientations (
Shapiro et al., 2017;
https://www.interactiongeography.org). We take
animation to incorporate (1) the methods for representing space, movement, and affect (i.e., animating data), (2) the social-material environment which animates the people and things we study (e.g., more-than-human animacies), and (3) the lively, energetic talk-in-interaction that takes place as people and things move (e.g., animated gestures). Literacy teachers, for example, often present materials using animated gestures, conveying meaning through the energy and vibrancy of their movements. At the same time, a teacher’s talk may be animated, or enlivened by assemblages of social-material contributors including their students, materials, or ideational resources. Similarly, we take
affect to incorporate relational experiences between animate and inanimate agents, including humans, more-than-human living beings, and the host of nonliving material objects that constitute environments for learning. Taken together, our perspective on animation and affect affirm what
Snaza (2019) refer to as a “politics of affective attunement” (p. 6), whereby literacy events include a wide variety of animacies, both human and more-than-human, which methods then animate.
We use a comparative case study to examine the strengths, limitations, and possibilities of interaction geography for early childhood education. Our first case uses interaction geography to animate what we call gestural energies and choreographies between a teacher, students, and materials in a bilingual kindergarten classroom activity. Our second case uses interaction geography to animate a young child’s excitement for learning and teaching through movement in a cultural heritage museum. Our discussion synthesizes our analysis to illustrate how interaction geography provides alternative ways to conceptualize the multimodal nature of literacy practices and contributes to a recent turn to affect in literacy research. We conclude by outlining several limitations of this method and additional implications of this work for architects, administrators, and researchers concerned with the physical design of literacy spaces.
Methods
Method and case selection
We use a comparative case study approach (
Yin, 2009) to explore how interaction geography supports new ways of understanding space and affect in different early childhood education settings. Case 1 draws from a 2-min video of classroom interaction that shows the teaching of a key idea in the physics of matter—that matter occupies space—in a kindergarten-first grade bilingual classroom. In the video, a teacher is seated with her students around her on the floor of a classroom and conducts a brief experiment involving a jar and sand to illustrate how matter occupies space. The teacher also facilitates a discussion about the experiment with the class. This dataset is a well-known and publicly available dataset originally collected by Kris Gutiérrez and colleagues (see
Gutiérrez et al., 1999;
Gutiérrez, 2008;
https://youtu.be/d8_pRUR-hmg) and has influenced literacy and learning sciences scholars in a myriad of ways (see
https://www.learninghowtolookandlisten.com).
Case 2 draws from data we collected during a larger 3-year project to understand how visitors cultivate interests in and learn about the diverse historical and cultural heritage of American Roots and Country music, as they visited a nationally renowned museum located in the mid-South region of the United States. As part of this project, we collected a purposive sample of complete museum visits across 22 visitor group cases (2–5 visitors per group) over a period of 6 weeks. Data collected from these 22 cases included continuous, multi-perspective video and audio records (72 h total) of each visiting groups’ movement, interaction, and social media use collected through small, unobtrusive cameras that each visitor in a group wore as necklaces for the duration of their visit with no researchers present (visits ranged from 30 min to 4 h). In prior work, we have analyzed this and other data including interviews with each family group following their visits as part of a larger, grounded theory analysis (
Shapiro and Hall, 2018;
Shapiro et al., 2017). In the current article, we focused on characterizing the movement and learning of a young 6-year-old boy named Blake across his complete visit.
As a set, the cases illustrate how interaction geography can be used at different scales to animate gesture and bodily movement as central to literacy. We selected these two cases for a variety of reasons. First, they reflect two principal settings for literacy research (i.e., classrooms and museums), allowing us to explore how interaction geography contributes to studies of space and affect in early childhood learning environments that center literacy practices. Second, they differ in temporal and spatial scales. The first case is a brief literacy event that occurs on the floor of a kindergarten-first grade classroom, while the second case spans an approximately 1 h long museum visit across two different floors of a museum. Third, video data from each case was collected in different ways. In the first case, video was collected from a single and stable camera placed near the activity, whereas in the second case video was collected from multiple cameras worn by each family member. Varying the perspective on recorded events allows us to animate participants’ differing movement patterns, intensities, and affects. Finally, both cases foreground materials as central in the literacy event, with potential to animate learning and teaching.
Positioning children-researcher-data-methods
We are mindful of the many ways that video-based research with children potentially subjects them to a researcher gaze that objectifies their affects and bodily movements. Researching children’s bodies as moving, feeling, affective agents unavoidably risks centering some experiences of children (or some children’s experiences), while excluding or erasing others. We acknowledge that, in the first case, the children and teacher are not known to us, and that the publicly available data has traveled far from the situated setting where it unfolded. The bilingual classroom depicted in this video is neither accessible to us through first-person accounts or interviews, nor familiar to us as monolingual English speakers. On the other hand, one of the authors had a relationship with the family featured in the second case; their interactions lasted a few months spanning their visit and subsequent interviews and digital exchanges with family members. We acknowledge the ways in which unequal relations of power exist between researchers-participants, between adults-children, and between data-lived experience. While interaction geography by no means dismantles these relations of power, we believe the approach contributes to qualitative perspectives aimed at representing typically invisible or erased aspects of human and more-than-human experience, such as affective intensities, the power of space, and the vitality of movement. Finally, we are likewise mindful that attempts to dismantle power relations through new forms of representations reinscribe an onto-epistemology that nonetheless rests on representations as complete and accurate renderings of reality. We attempt to hold together both the ability of animations to disclose affectively powerful phenomena and to foreclose the full knowability of a literacy event.
Transcription and interaction geography analysis
We use interaction geography to explore each of these video datasets in new ways. Interaction geography is a geographic information systems (GIS) approach to mapping embodied interaction. It integrates ideas from geosemiotics (
Scollon and Scollon, 2003), a geographical perspective called time geography (
Hägerstrand, 1970), and approaches to transcribing and representing the movement of people and things (e.g.,
Hackett, 2014;
Jewitt et al., 2016;
Ingold, 2007;
Marin, 2020;
Taylor, 2017). This approach is beginning to be used and expanded in areas including interior design and virtual environments (
Vo and Huesemann-Odom, 2022), early childhood education and computational thinking (
Berson et al., 2023), museum studies (
Shapiro et al., 2017), and teacher education (
Shapiro and Garner, 2021).
Interaction geography encompasses
Mondrian Transcription, a process supported by software to manually transcribe video data about people’s movement and conversation, and the
Interaction Geography Slicer (IGS), a dynamic visualization tool that allows for exploratory analyses and animations of movement and conversation in relation to audio and video. These free and open-source tools were developed by one of the authors to address the lack of methods for transcribing and analyzing multimodal, spatiotemporal, and geographically situated interactions (see:
https://www.interactiongeography.org).
For each case, we used Mondrian Transcription software to manually trace movement in different ways over images or floor plan representations of classroom and museum spaces. For example,
Figure 1 shows a screenshot from the Mondrian Transcription tool and excerpts from our process to transcribe the teacher’s gestural movement that we will analyze in Case 1. The figure shows how we have used the Mondrian Transcription tool to trace the movement of the teacher’s right hand over an image from the video and how this produces a text file of “positioning data” – essentially, a very fine grained transcript of movement – that can be used in other tools such as the IGS.
For Case 1, we transcribed the gestural movement of both teacher’s hands as well as the gestural movement for particular students. We also transcribed the movement of artifacts and materials in the same manner. For Case 2, as opposed to gestural movement, we transcribed the bodily movement of Blake as well as other family members over floor plans of the museum.
The Mondrian Transcription tool provides different features such as fast forwarding and rewinding that support efficient manual transcription of dynamic movement. For example, we were able to trace gestural movement for each hand from the 2-min video in approximately 10 min and the movement of a family member across an hour-long museum visit in approximately 45 min. Likewise, while this manual transcription process is slow, it is fundamentally different from automated techniques and allows one to feel the ebbs and flows of the movement of people or things in ways that contribute to subsequent experiences with data, interpretive analysis, and exploring affect in the IGS.
Subsequently, we used the IGS to synchronize, visualize, and animate these movement transcripts alongside transcripts of conversation, and the original video data, allowing us to visually explore and experience video from each case in new ways. Through the cases, we illustrate this methodological approach and offer new avenues for exploration of space and affect by literacy researchers and practitioners.
Case 1: Animating gestural energy and choreographies in a bilingual kindergarten classroom activity
Background
Children learning to read, write, and express themselves through multiple literacies often rely on multimodal resources like gesture to convey ideas. Likewise, early childhood teachers may mirror or model gesture when interacting with their students. In bilingual learning environments, the paralinguistic and linguistic resources are multiplied, as students and teachers with different language and literacy backgrounds learn to speak and interact with each other. Yet, most accounts of gesture use static and pictographic methods to characterize different dimensions of gestures such as iconic, metaphoric, deictic, or beat (see
Alibali and Nathan, 2012;
McNeil, 1992) and typically analyze empty-handed gestures or gestures where people do not hold materials or artifacts. When materials or artifacts are taken into consideration, the emphasis tends to be on how they are indexed, rather than on understanding the affective, relational dynamics between artifacts, materials, bodies, and gestures, and how they collectively shape interaction and experiences. In other words, we are moved by things, and
we also move things, and both matter for how affect unfolds.
In this case, we use interaction geography to animate what we call gestural energies and choreographies between a teacher, students, and materials in a bilingual kindergarten classroom activity. Drawing from the two-minute video recording during a bilingual kindergarten classroom activity introduced previously, we first highlight the teacher’s gestures and coordinated gestures of one student during this activity as a means of animating gestural energy and choreographies. Subsequently, we shift our focus to characterizing the movement of artifacts and gestural-material-bodily energies in this scene. While we separate our analysis into distinct sections, we intend them to be read relationally in ways that reflect the potential of interaction geography to shift between interactional scales, layers, and analytic views of diverse data.
Experiencing a teacher’s gestural energy in the IGS
Figure 2 is a screenshot from the IGS that displays the teacher’s gesture transcribed from the focal 2-min activity in a 3D space-time cube, one of many possible views in the IGS. In the figure, the image from the video used to transcribe the teacher’s gestural movement is tilted in 3D perspective and the transcribed movement of each of the teacher’s hands is drawn upwards in a “space-time view” as it unfolds over the two-minute activity. The orange path represents movements of the teacher’s left hand, and the purple path, the teacher’s right hand. In the space-time view, the z-axis encodes time, and the x/y axes correspond to spatial locations on the image. Thicker lines indicate periods of time when the teacher’s hands are not moving. The following video animates this figure and better conveys the animating possibilities of the IGS that expand our interpretation and experiences of this kind of representation:
https://youtu.be/cXuK7ETB00E Producing the figure and video animation with the IGS highlighted several dimensions of gesture that are powerful parts of classroom interactions seen and felt, but not often transcribed in literacy research. First, the teacher is using a significant amount of gesture to conduct an experiment with her students as they sit together on the floor during this short activity. As opposed to static pictographic representations of discrete gestures or gesture sequences, the animation reveals the sheer density and frequency of gesture this teacher uses during the activity. There are very few segments of the video where her hands are still and resting, which is represented by the thick straight lines in the space-time view. For instance, in the figure we mark a long period of time when both her hands are at rest in her lap for 20 s. Closer analysis in the IGS reveals that during this period the teacher is not talking but listening to a student speak. Animating the IGS allows us to see that when the teacher rests her hands on her lap, she is typically listening to students talk and makes visible how this teacher weaves talking/gesturing with listening.
Second, producing the animated transcription of gesture by tracing this modality was a way of experiencing the ebbs and flows and overall pace of the teacher’s hand and arm movements as they evolve across the activity. Bursts of intense gestural sequences are highly visible in the figure, the pace of which are further amplified in the animated video. For example, in the figure we mark a period when both teachers’ hands are moving rapidly in circles. Closer analysis of these movements in the IGS alongside the video highlights how she is using these gestural movements to animate how the sand in a jar that sits in front of her is “dancing” after she pours water into the jar. Her hands dance in choreographed circles through the air as she demonstrates the dancing sand.
Third, how and where this teacher uses gesture to coordinate attention becomes visible in new ways. The shape that the paths take along the x/y axes reflects the shape that the teacher’s gestures make in the space. There is a centeredness to the teacher’s gesture. It is focused directly in front of her during the entire activity, reflecting her efforts to coordinate the student's gaze on a jar, which is central to the experiment and that rests just in front of her. Yet, there are times when her hands and arms burst out from the center, moving up, around, down, and center again. Like a conductor holding a wand, these bursts outward or upwards punctuate important points the teacher is making.
Finally, the teacher’s gestures reflect her efforts to animate the experiment and especially the physical properties of the jar for her students so they can learn how “matter occupies space”—words she rarely says during this activity but constantly animates through her gesture. When the teacher dramatically gestures to explain how matter occupies space, she is filling up the space with her movements, embodying the physical principle she is illustrating. Animating her movements shows us how she is animating the physical principle through highly animated gestures and bodily affects made visible in the IGS. At the same time, the physical properties of the contents of the jars, which bubble up when she combines sand with water, animate the teacher’s talk and gesture. The jar animates the teacher, who responds with animated gestures, and both then animate a student, who recycles these actions in concert.
Layering the coordination of student and teacher gesture
Just as gestures often involve environmentally coupled referents, they tend to be shared and recycled between people during interactions (
Goodwin, 2018). As people interact with one another and their physical surroundings, gestures unfold within a social-material environment that is charged with affect and meaning. Next, we describe how we layered one student’s gestures onto the teacher’s and what this helped us see about their shared embodied experience of being in conversation with one another.
Figure 3 is another screenshot from the IGS that shows the teacher’s gesture alongside those of the student positioned to the teacher’s immediate left during the entire activity. The teacher’s gesture is shown in gray, while the student’s hands are represented as brown paths, and green path segments indicate when the student is speaking: The IGS allows one to load and read conversation transcripts in ways that also can be used to color code movement paths. We again include a video animation of this figure to better illustrate animation possibilities of the IGS that enliven an understanding of this student’s gesture in relation to the teacher:
https://youtu.be/VEbysht6rvQThe figure makes several facets of interaction visible. First, the figure highlights how the student’s gesturing is different from the teacher’s gesturing. The student’s hands rest much more often and for longer periods of time, while the overall pace of her gesture is much slower. The figure also suggests a possible reason for this is that the student is listening for most of the activity until the very end when she gestures with both hands as she is speaking. Second, the figure illustrates gestural bursts by the student, indicating where the student became animated. For example, our annotations highlight gestural bursts where the student reaches behind the teacher to give her a hug and express her affection, raises her hand to ask a question, and performs a demonstration with both of her hands.
Finally, the coordination between the teacher’s and student’s gestures as it evolves across the activity is visible. The activity begins with the teacher exhibiting a great amount of gesture as she sets up the context of the science experiment. During this time the student’s hands rest on her lap as she listens to the teacher. Over the course of the activity the teacher’s gesture slows as she begins to listen to students. During this time the focal student slowly raises her hand, and eventually is given the floor by the teacher (who then engages in her 20 s of gestural rest). Subsequently, the student performs a demonstration with both of her hands. As the student demonstrates with her hands, she speaks Spanish, and in
Figure 3 her gestural paths are thus green: Her talk compares the experiment with the jar and gas as it rises to a fizzy coca-cola bottle. As the student physically gestures in the space, she also gestures in a metaphorical way to the world beyond the classroom that is animating her meaning-making within it.
Moreover, all her gestures are attuned to the affectionate and animated teacher guiding the lesson. The IGS animation video shows how the student’s gesture can be understood as part of her efforts to re-voice the teacher’s demonstration, highlighting how re-voicing is not only conversational (
O’Connor and Michaels, 1993) but can be enacted over time through bodily movements. Together, the student and teacher can be seen to choreograph their gestures, much as people attune to one another and the material world through choreographies of attention (
Tulbert and Goodwin, 2011). Animating the student’s gestures alongside the teacher’s helps us see how people use bodily resources to coordinate affects with one another and as they co-constitute socio-material spaces for learning and teaching.
Exploring gestural-material-bodily energies and choreographies in the IGS
Next, we describe how we used the IGS to conceptualize gestural energies and choreographies in relation to artifacts and materials. Artifacts and materials in this scene are diverse and include the jar, rug, clothing, and other classroom artifacts. Here, we use the IGS first to map the movement of each jar used in the activity and subsequently, pieces of paper that each student and the teacher hold during this activity.
Figure 4 shows several screenshots from the IGS that illustrate diverse ways to layer movement traces and images. In each screenshot, color indicates individual artifacts, and each artifact is highlighted on each image in black. We include an animated video of one screenshot from this figure to illustrate possibilities of the IGS as an animation tool that enlivens an understanding of materiality, in this case of the combined movement of pieces of paper held by each student and the teacher during this activity as shown in
Figure 4(c):
https://youtu.be/SU140nnu_LI As the literacy event unfolds, the jar containing sand and water is the central material focus.
Figure 4(a) shows two traces that depict the movement of each jar used during the activity. Initially, the jar of water rests at the center of the circle and activity as depicted through a straight, thick line that extends upwards in the space-time view located in the center of the circle. Early in the activity, the second jar containing sand plays an active role. As the space-time view shows, the teacher moves the jar early in the experiment to pour rocks and sand into the jar of water, and subsequently moves it outside of the circle where it remains still for the rest of the activity. Movement of hands and artifacts are coupled during active demonstrations, and gesture involves both indexing and dynamically moving the focal materials.
The jars of water and sand are not the only things on the move during the activity. There is an ongoing coupling of paper and bodies during the activity that is backgrounded compared with the animating energies of the jars. Nonetheless, the sheets of paper each child holds play a role in how movements, materials, and space can be animated in the data. For example,
Figure 4(b) shows how midway through the activity, one student gets up from her seat and shifts positions in the circle, bringing her paper along with her. Specifically, a portion of the path in the space-time view traces the movement of paper as she holds it and walks around the circle to assume a new position.
Mapping all the children’s movements in this way immediately highlights the sheer amount of energy of the papers in this scene (
Figure 4(c)). While the teacher emphasizes the jars through words and gestures, through the IGS, we also understand the papers as a central actor, as we see flows of each individual paper trace and a broader choreography of paper movement in relation to the movement of the jars. Notably, there is very little movement of papers at the start of the experiment. Then, in concert with the teachers’ gestural movement described previously in terms of a conductor’s wand, as the activity unfolds, a chorus of paper movement erupts across many of the students. Each individual child-and-paper contributes to this chorus, a choreography of movement that is challenging to comprehend solely from video. From the animation, we also observe that many students sitting close to the teacher do not move their papers, as indicated by thick straight lines extending in the space-time view; instead, most of the paper movement occurs from students seated on the outside the circle, whom have space to move and explore, highlighting one way spatial positioning, paper, and movement are connected.
Finally, we can look across animations to get a sense of how the teacher’s gestures analyzed above relate to the moving papers.
Figure 4(d) shows only the movement of all papers when the teacher’s hands are not moving. On one hand, this demonstrates ways to use interaction geography to look at the movement of materials and gestures relationally—in this case by using the IGS to select only paper movement when the teacher is not moving or gesturing. On the other hand, it further emphasizes how much the teacher moves at the start of the activity, as little paper movement is displayed, and diverse patterns of movements students make with papers occur later in the activity. Together, our analysis shows how interaction geography presents new ways to consider relations across materials, gestures, and bodies. While this case occurs at the scale of a seated classroom lesson, the next case uses interaction geography to explore broader temporal and spatial scales of different phenomena and settings central to literacy research.
Case 2: Animating a young child’s excitement for learning and teaching in a museum
Background
Historically, research in museum studies has importantly focused on how young children learn through their conversation with family members and interaction at exhibits or how long they stand at a particular exhibit (see
Allen, 2002;
Crowley and Jacobs, 2002;
Roberts and Lyons, 2017;
Serrell, 1994;
vom Lehn et al., 2002). Yet, literacy scholars have shown how young children’s dynamic movement or “zigging and zooming” across exhibits and gallery spaces is also critical to how they engage and learn in museums (
Hackett, 2014; also see
Christidou, 2018;
Hackett et al., 2018;
Kelton, 2021). These same literacy scholars continue to highlight the need for more dynamic and experiential methods to conceptualize and enliven children’s movement through museums.
Our second case analysis uses interaction geography to animate the movement of a 6-year old boy named Blake across a 1 hour-long museum visit with his family to better conceptualize young children’s movement and learning in museums. Other family members include Adhir (25 years old), Jeans (10 years old), Lily (20 years old and Adhir’s fiancé), and Mae (the mother of Blake, Jeans and Lily). Blake and the rest of his family are a group of professional Bluegrass musicians, and the chance to visit artists and instruments on display in certain gallery spaces in this museum represents, in their words, a “once in a lifetime experience to meet their heroes.” Furthermore, Blake had visited this museum previously with his mother and brother Jeans and thus, during this visit was eager to share the museum with his family, particularly Adhir.
We begin by showing how animating Blake’s movements across the entire museum visit helped us experience his excitement and identify gallery spaces where he became excited through his movement. Then we again overlay a second animation from the IGS to show how he used his movement to animate his own personal interests and excitement to teach other family members about musical instruments in one gallery space.
Experiencing Blake’s zigging and zooming across his visit
Existing research has rarely provided views of young children’s movement across the duration of a complete museum visit.
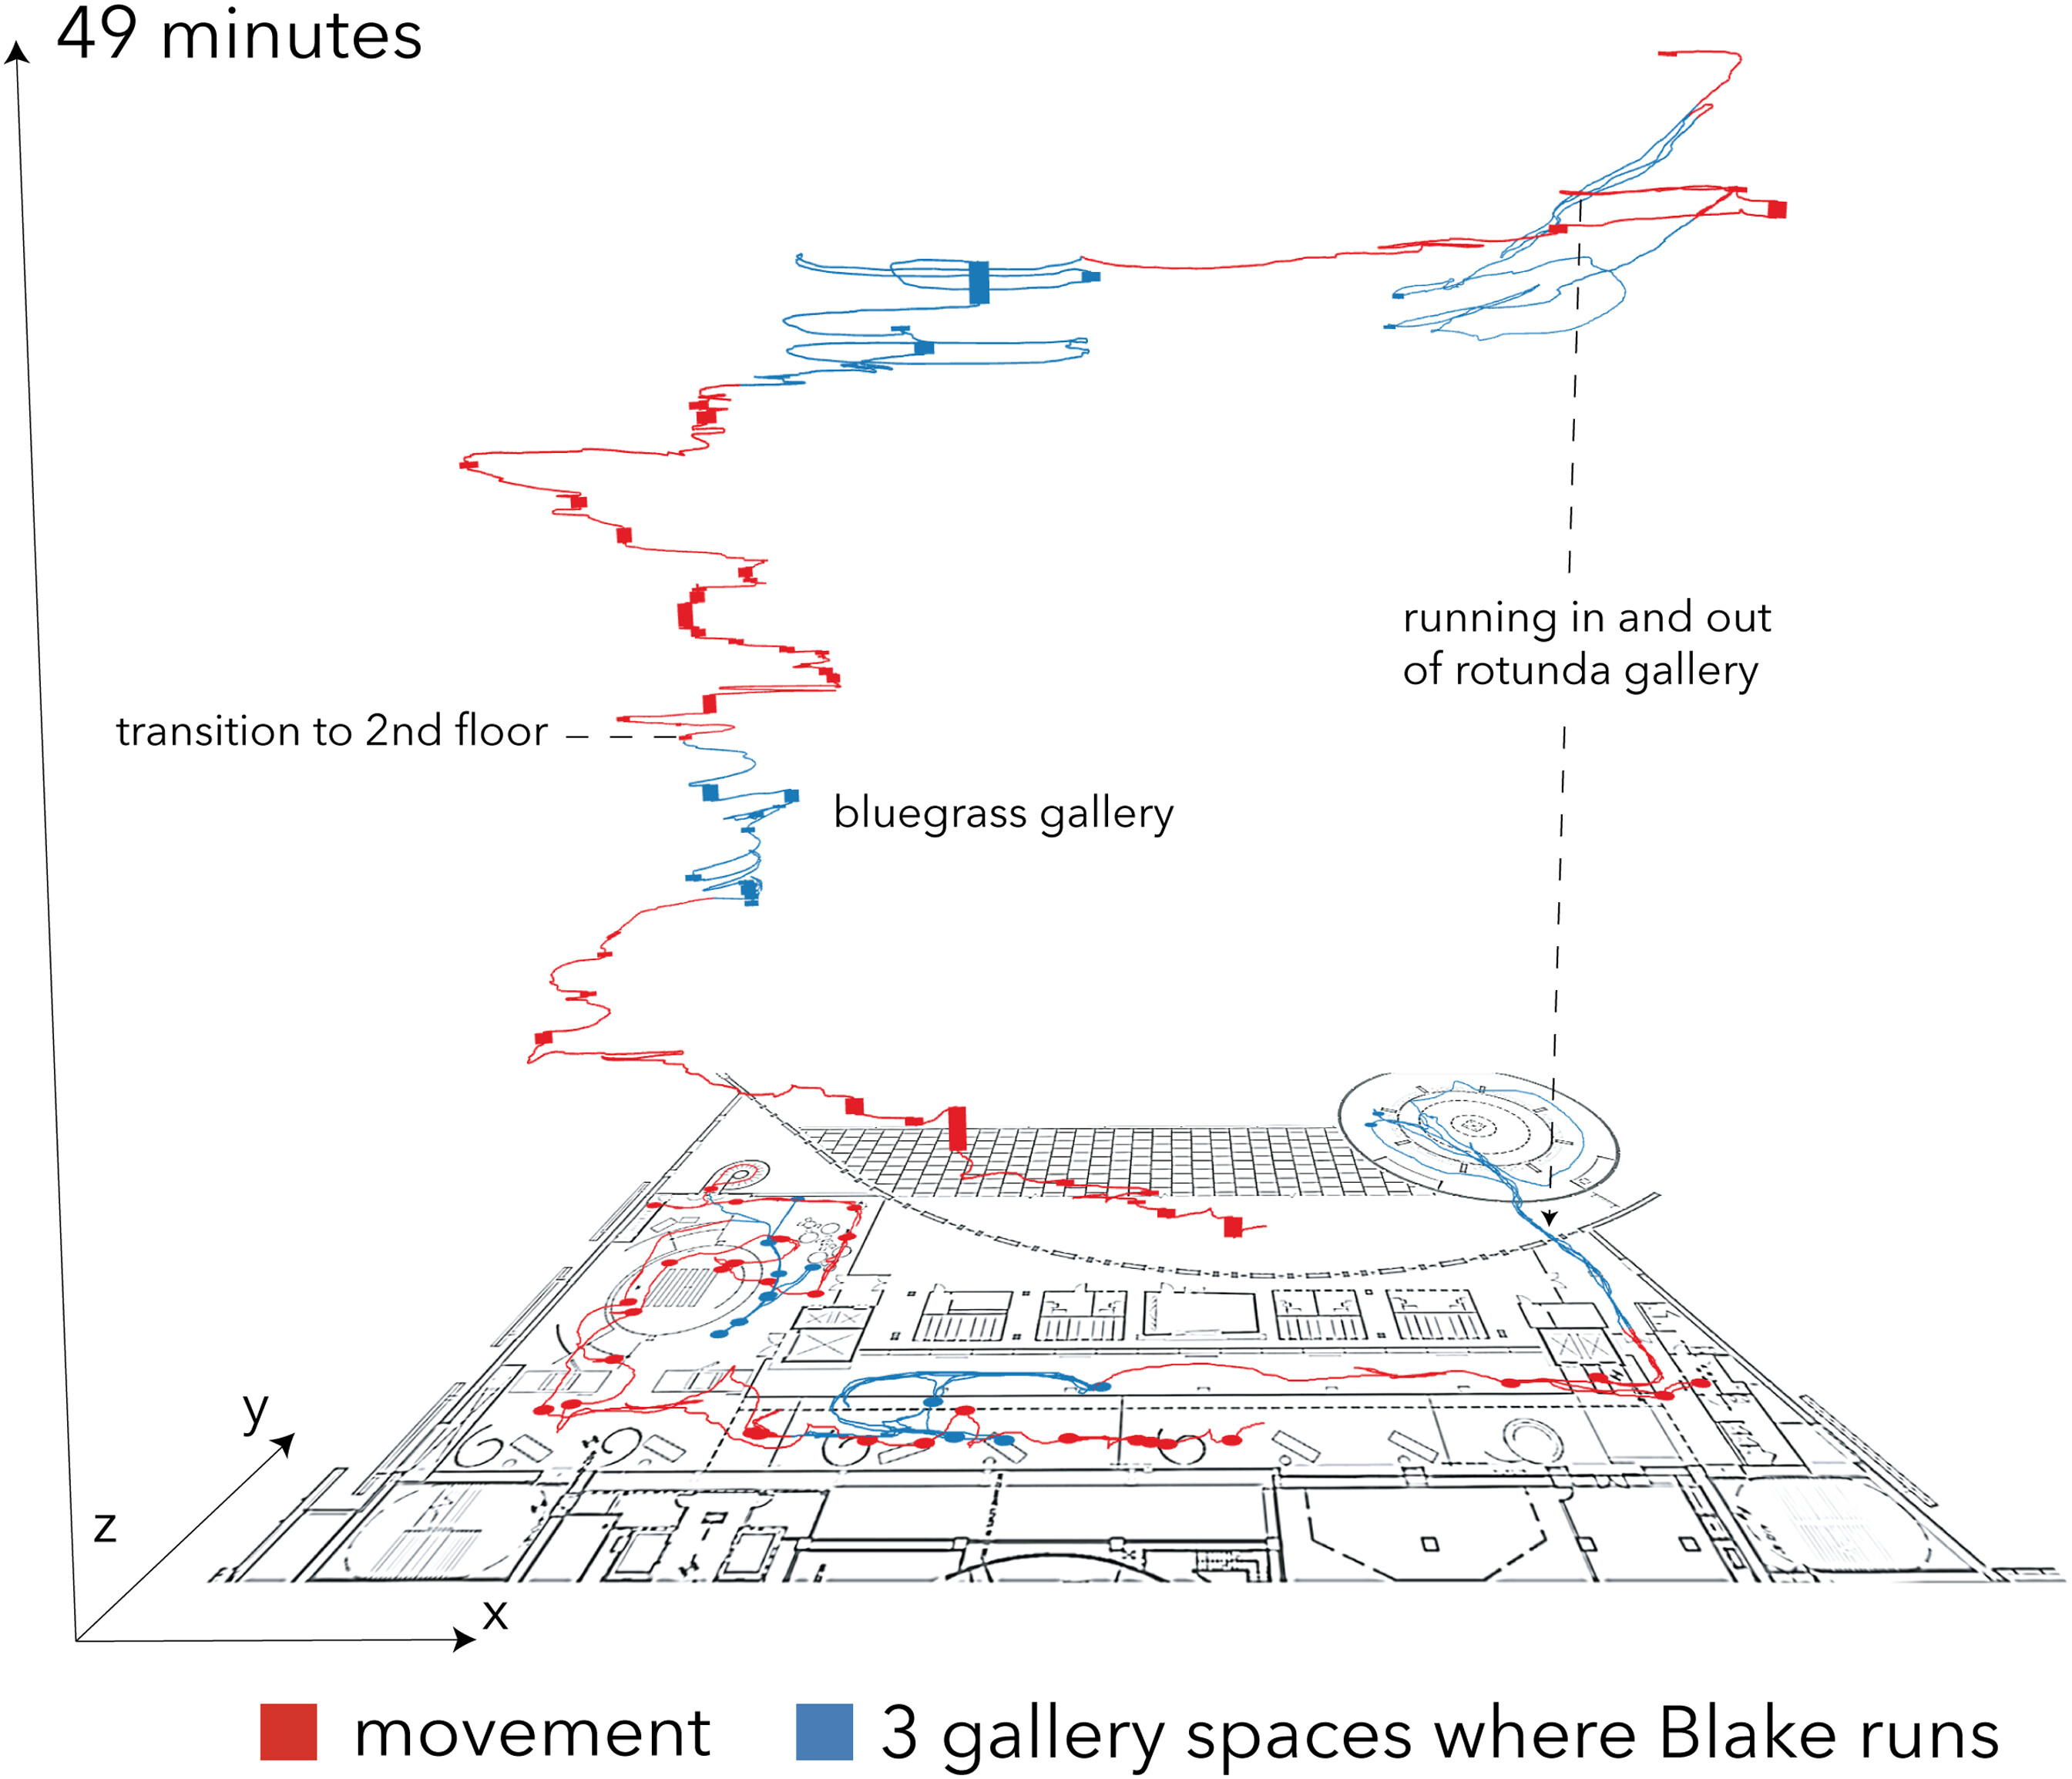
Figure 5 is a screenshot from the IGS that shows Blake’s bodily movement across his entire museum visit. We again traced his movement using Mondrian Transcription. However, in this case, rather than focus on Blake’s gestures while seated (which he never was), we traced his whole body movements across the museum, through different gallery spaces, and across two different floors that comprised this museum.
We represent Blake’s movement in two viewpoints. First, tilted on the x-y axes, his movement is shown over a floor plan of the museum, or in “floor plan view.” This view shows all the places Blake goes across the museum. In this view, dots along Blake’s path mark places where he stops for 10 s or more. Second, and like our first case analysis, Blake’s movement is also drawn in a space-time view. This view reveals where and when he moves and stops. Thick, straight lines in the space-time view again mark places and periods of time when Blake is standing still for more than 10 s. Blake’s movement through the whole museum is drawn as a red path, whereas blue path segments encode his movement in 3 separate gallery spaces. The screenshot shows Blake’s movement across two floors. Thus, approximately mid-way through the space-time view we mark a point where Blake descends to another floor of the museum. His subsequent movement then appears as if he is walking back across the museum, however, he is doing so on a different floor of the museum. Once again we include an animated video of this figure that better conveys Blake’s animated movements across his visit. Notably, unlike the first case the speed of the animation is faster than real time:
https://youtu.be/3xOim7mT39EProducing the figure and video animation of Blake’s movements drew our attention to several aspects of his experience in the museum space and underscored how research with “young children in museums involves experiencing with the body, in ways that defy verbal explanation” (
MacRae et al., 2018: 509). First, animating Blake’s movement shows how much he was moving around the museum. As with the teacher, who only briefly stopped gesturing and brought her hands to rest, Blake’s movements are nearly constant, punctuated by occasional circles or dots of stillness (or thick straight bars). Second, by tracing his movements, we saw and experienced the ebbs and flows of Blake’s movement across his visit, particularly in the space-time view. His zigging, zagging, and zooming was re-enlivened by tracing his movements, which were neither linear nor predictable.
Third, the blue path segments in the space-time view delineate three separate gallery spaces through which Blake is running, spaces that materialize through retracing his movement path zig-zagging back and forth across the museum. With the animation, we further experienced periods of time, places, or parts of his path where he was moving quickly in order to show the intensity and affect of Blake’s experience in the three gallery spaces. For example, in one gallery space where he was running, marked as the Rotunda gallery space in the figure, Blake’s movement encompasses running in and out of the gallery space. In this case, these movements reflect his efforts to find his brother Jeans in another gallery space to ask and answer a question about exhibit content and subsequently, share this answer with Adhir, who remained in the Rotunda gallery space.
Layering Blake’s enthusiasm to teach Adhir
Blake’s movement across his visit was made even more meaningful through his interactions with his family and particularly, with Adhir. Next, we zoom in and focus on Blake and Adhir’s layered movement and interactions in the Bluegrass Gallery space (marked in the previous
Figure 5). We show how doing so allowed us to see how Blake’s movement reflected his enthusiasm to teach Adhir about exhibits in this gallery space.
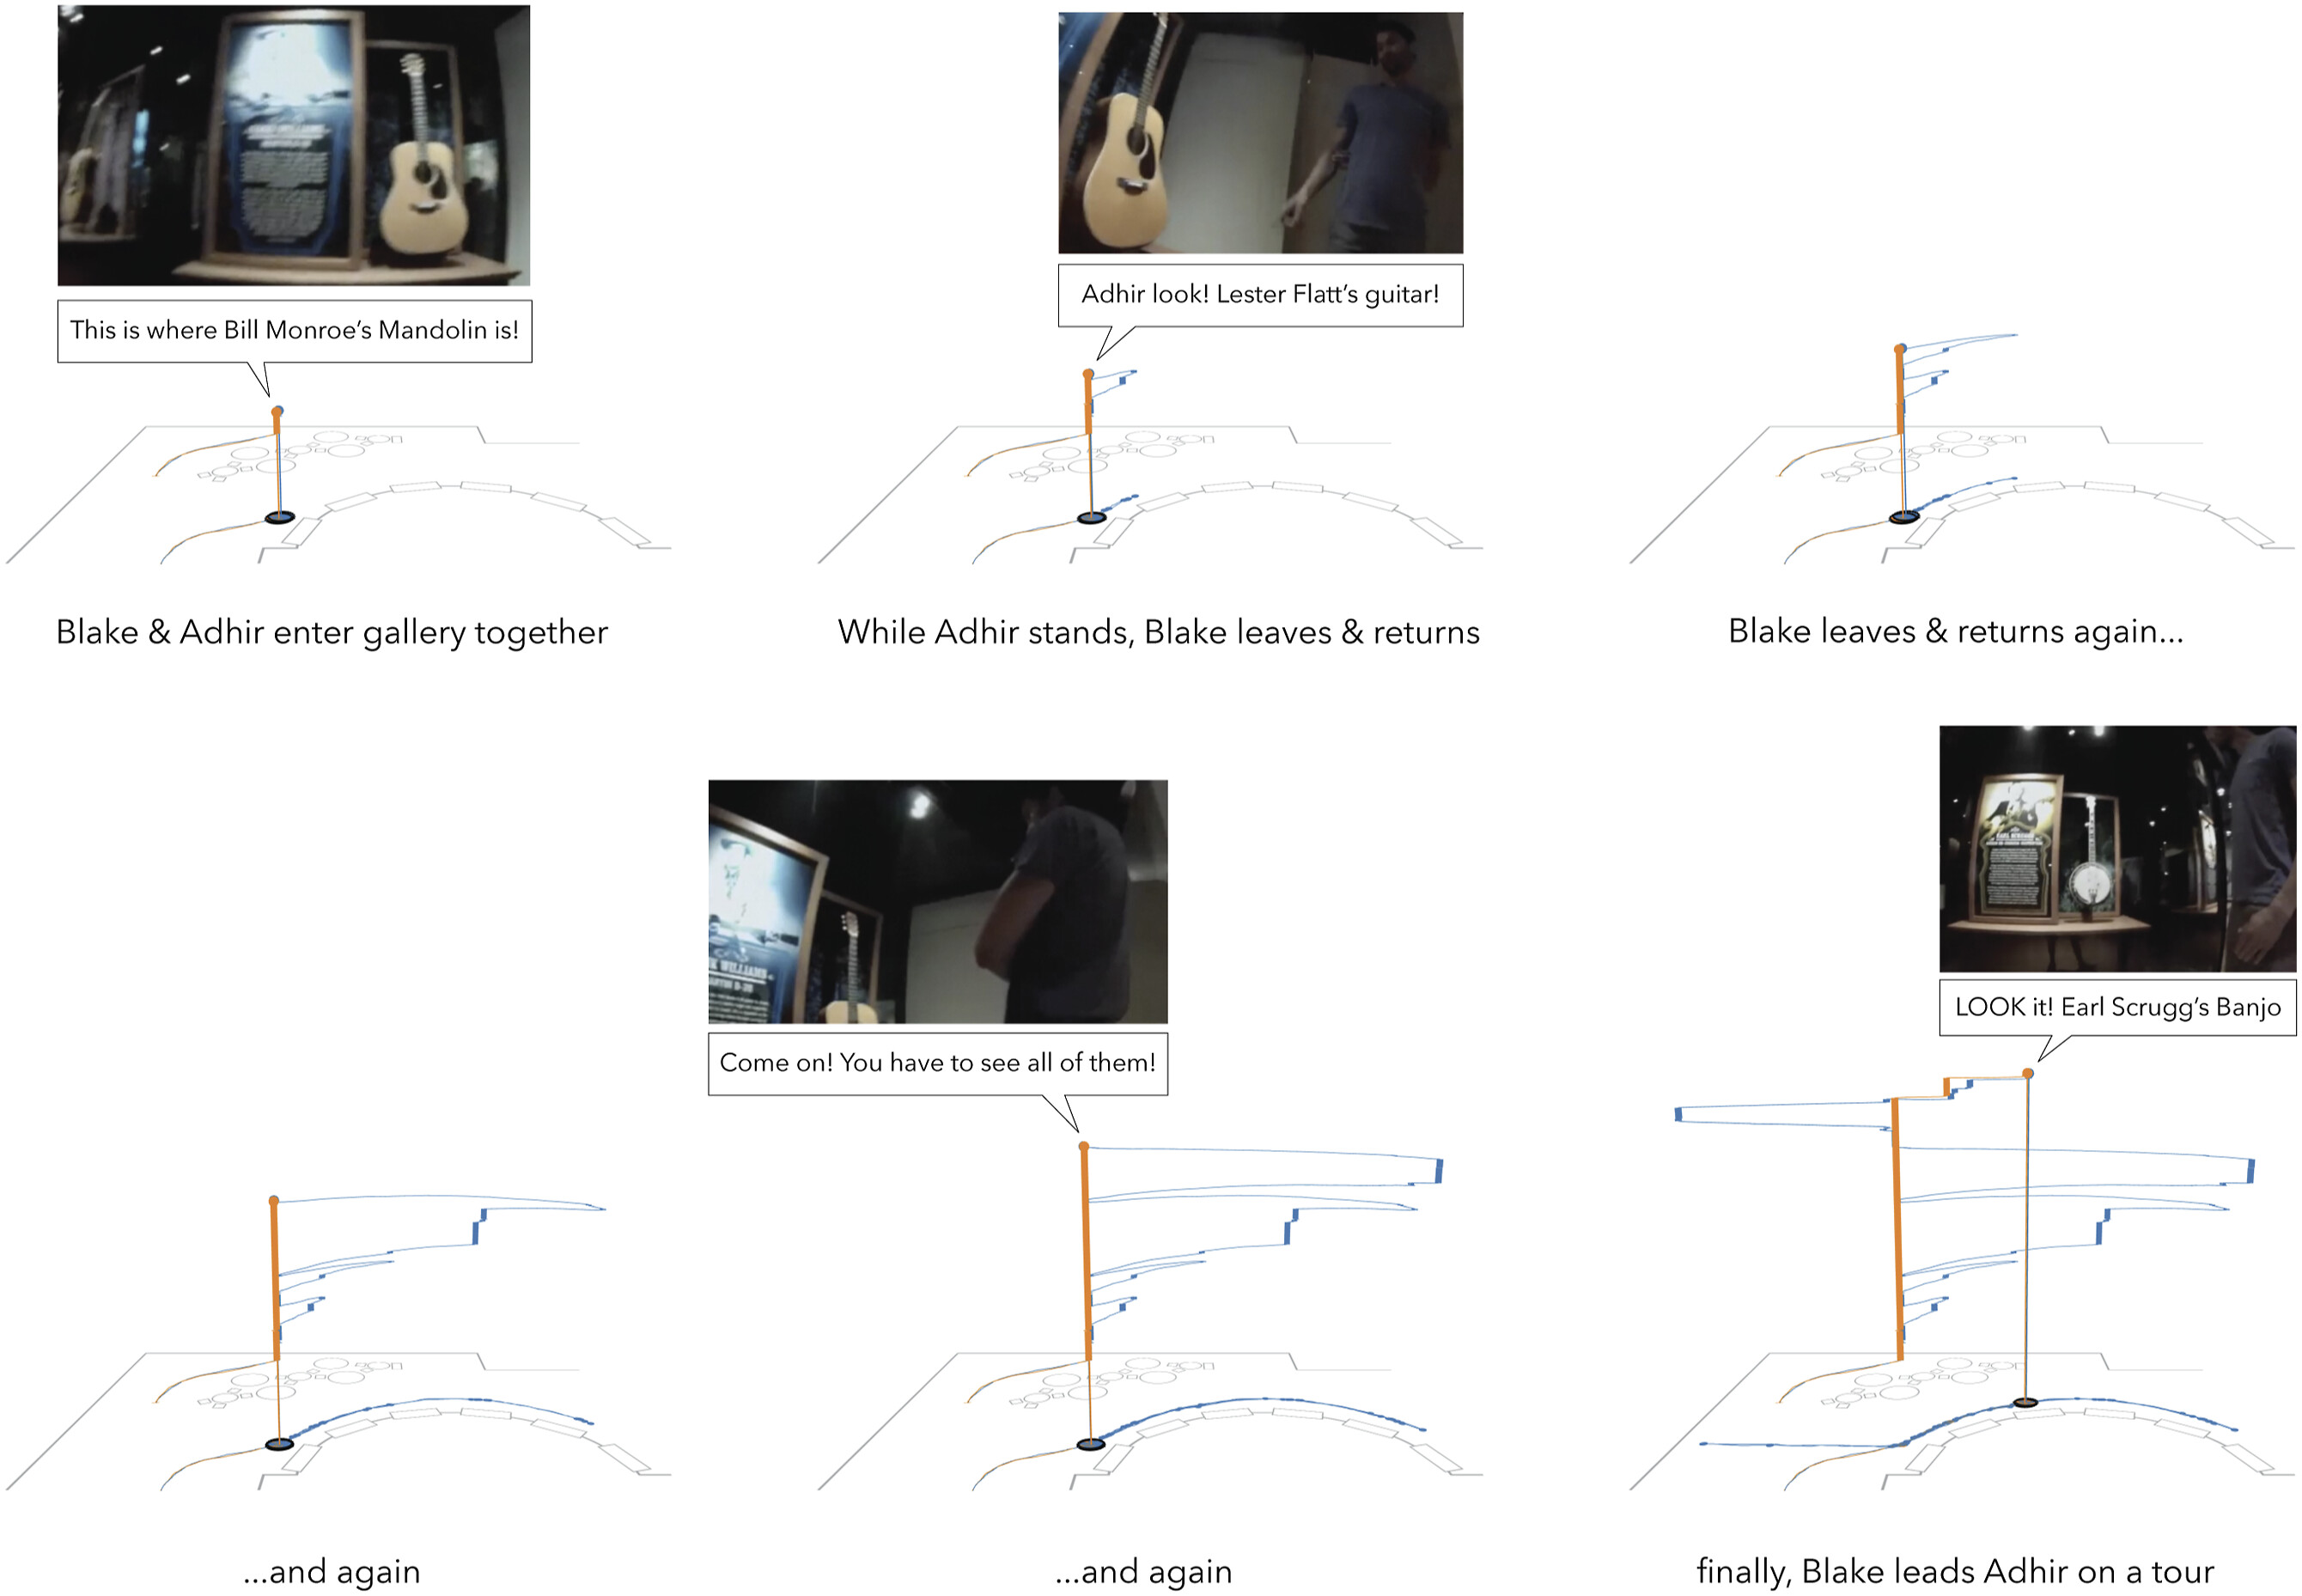
Figure 6 displays a series of screenshots from the IGS that layer Blake and Adhir’s movement in the Bluegrass gallery space as it evolves over approximately 9 min they spend in the space. Blake’s movement and all stops are shown as a blue path, and Adhir’s movement is shown as an orange path. Video images and conversation turns from a moment in each screenshot are also shown, illustrating how the IGS can be used to simultaneously explore movement, conversation, and video. We again include an animated video of this figure:
https://youtu.be/7POS_1IWPbw Beginning from the top left screenshot, the figure highlights how Blake and Adhir enter this gallery space together with Blake exclaiming to Adhir “this is where Bill Monroe’s mandolin is” to emphasize the importance of this gallery space. After standing together for approximately 1 minute at an exhibit for a famous musician named Hank Williams, Blake quickly moves to the next exhibit along a prominent semi-circle of exhibit cases that feature instruments from renowned Bluegrass and early Country musicians Hank Williams, Lester Flatt, Earl Scruggs, Bill Monroe, Maybelle Carter, and Jimmie Rodgers. He subsequently returns to Adhir to tell him that the guitar of another important musician, Lester Flatt, is featured at the next exhibit. Blake runs back and forth between Adhir and exhibits along the semi-circle multiple times, at one point encouraging him to visit other exhibits by insisting, “Come on! You have to see all of them!”
During this time Adhir remains standing at the Hank Williams exhibit for almost 5 min as indicated by the long, thick, vertical line that extends upwards in the space-time view. Closer analysis of the video in the IGS reveals that he is almost moved to tears by the Hank Williams exhibit as he stands in silent reverence of an artist who has deeply shaped his own life. Such sequences of rapid movement and stillness/reverence are further amplified in the animation video.
Finally, the last screenshot of the figure shows that after one more excursion to another part of the gallery space, Blake rejoins Adhir and is finally able to lead Adhir on what we call a tour of the other exhibits along the semi-circle. This tour is marked in the space-time view where their paths intertwine. During this tour Blake highlights specific features about each exhibit and shares his love for each featured artist in ways that allow Blake and Adhir to experience this place together. For example, the screenshot highlights how Blake excitedly proclaims to Adhir at one point along his tour, “LOOK it! Earl Scrugg’s banjo.” Indeed, Blake has visited this gallery space before and his frenetic movement reflects his desire to teach Adhir about the exhibits in this gallery space.
In summary, Blake’s movement conveys both excitement and enthusiasm for a topic of interest (i.e., music) but also reflects his efforts to make a place for teaching Adhir. In contrast, Adhir’s stillness reflects deep reverence for a particular musician. Together, our analysis highlights how Blake and Adhir’s movements are deeply intertwined and how movement and stillness shape Blake’s and Adhir’s engagement and learning in this gallery space. Put differently, animating movement in the IGS is a means of representing how bodies flow together and apart, how bodies are moved (in space) and can be moved (to tears), and how material surroundings are populated with beloved objects that animate moving bodies.
Limitations and next steps
Like much of the work highlighting inherent challenges of characterizing space and affect, there are limitations and critical considerations for interaction geography. First, while interaction geography foregrounds the role of manual transcription and animation, it also uses visualizations that characterize people and things through grammars such as paths. Like all visualization grammars, such representational techniques are highly reductive, do not characterize many aspects of everyday life and experience, and are not neutral with respect to dimensions of hierarchy and power (see
Buckley and Waring, 2013).
Second, because it emphasizes representation(s) (i.e., visualization, animation), interaction geography may needlessly contribute to representationalist notions of truth and verifiability from data that work against efforts to “inform the possible in social imaginings” (
Hickey-Moody, 2013: 85). Interaction geography presents only one of many possible approaches to characterizing space and affect, thus its products should be read as only one of many possible animations of affect. Interaction geography seeks to provide an integrative and flexible approach that complements existing representational and post-representational approaches, recognizing the value of multiple approaches to characterizing space and affect.
Third, Mondrian Transcription and the IGS as described in this article remain early in their development and have many limitations with respect to usability, the data they can support or generate, and the conventions used. In collaboration with others, we hope to continue to expand the capabilities and possibilities of these tools.
Lastly, we underscore the importance of advancing discussions about data ethics when studying movement, space, and affect in the ways outlined here. Collecting data on teacher and student movement should raise concerns about privacy, the growth in surveillance in schools, and the need for policies to guide appropriate use of manual or automated data collection in public and private spaces. Approaches such as interaction geography raise new ethical questions concerning the use and communication of classroom data that emphasize the need for collaborations between researchers and teachers when using interactive visualizations, while also recognizing there will be settings where such approaches are not appropriate. As we animate data in new ways, we urge literacy researchers to heed concerns about data ethics in the variety of literacy events and environments where interaction geography can be applied.