Introduction
Although the prevalence rate for violence victimisation is relatively low in England and Wales (0.8%;
Office for National Statistics (ONS), 2022b), it has many negative effects, including emotional and/or physical impacts, increased isolation and withdrawal from social life (
Jackson and Gouseti, 2016;
Semenza et al., 2021;
Shapland and Hall, 2007), as well as a significant cost to the public purse. The estimated total cost of violence with injury was £15.5 billion in England and Wales in 2015/16 (
Heeks et al., 2018) and the total cost of violence in London alone in 2018–19 was £3 billion (
Jones et al., 2020). Moreover, victims
1 of violence suffer effects for longer periods of time compared to victims of other crime types (
Hanson et al., 2010) and members of some social groups are at higher risk for victimisation than others (
Cooper and Obolenskaya, 2022;
Ganpat et al., 2022;
O et al., 2017). Therefore, the mapping, understanding and prevention of violence are high priorities for researchers, the UK Government, police forces and the general public, including potential victims and concerned community members.
Intersectionality is a critical theory that provides an important framework for understanding the root social drivers of risk of victimisation, including sexism, racism, ableism and other systems of oppression, and consequently how experiences of victimisation come to be patterned unequally across social groups (
Crenshaw, 1989,
1991). Intersectionality also encourages a holistic understanding of the diverse drivers of these inequalities, and expansion of analyses to consider greater diversity. Some studies have attempted to utilise intersectionality by including interaction terms in their single-level regression models, in order to estimate unique levels of victimisation experiences in multiple intersectional social groups (e.g.
Cooper and Obolenskaya, 2022;
Gonçalves and Matos, 2020;
MacQueen, 2016;
Whitfield et al., 2021), however there are limitations to the number of terms one can practically accommodate before these models become prohibitively complex to interpret (
Evans et al., 2024). Furthermore, the inclusion of interaction terms implicitly reinforces the idea that the reference groups (such as White, middle-aged men) are the ‘norm’. Such a practice can inadvertently centre these groups as the standard against which others are compared, potentially skewing any understanding of social dynamics and inequalities. Recognising individuals’ intersecting identities acknowledges how certain intersectional strata experience increased or decreased advantage (such as young disabled women or old non-disabled women), and that their risk of experiencing stranger, acquaintance, or domestic violence victimisation can likewise increase or decrease. In addition, whether an intersectional stratum is deemed as high or low risk may also depend on the type of victimisation experienced.
This study therefore investigates intersectional disparities in experiences of three separate types of violence victimisation: stranger, acquaintance and domestic. Stranger violence includes wounding and assaults in which the victim did not have any information about the offender(s), or did not know and had never seen the offender(s) before. Acquaintance violence comprises wounding and assaults in which the victim knew one or more of the offenders, at least by sight (does not include domestic violence). Domestic violence comprises wounding and assaults that involve partners, ex-partners, other relatives, or household members (
ONS, 2024). The present study focuses on these victimisation types because (1) there is limited literature on the intersectional nature of victimisation experiences, (2) most studies that consider intersectional identities have focused on intimate partner or sexual violence (
Gonçalves and Matos, 2020;
Ivert et al., 2020;
MacQueen, 2016) and (3) ‘violence provides an especially rich entry point for studying the theoretical and political contours of intersectionality’ more generally (
Collins, 2017: 1460).
The present study analyses a ‘gold-standard’ victimisation survey (
Flatley, 2014), the Crime Survey for England and Wales, using a ‘gold-standard’ method (
Merlo, 2018) that was proposed and developed by
Evans et al. (2024,
2018); multilevel analysis of individual heterogeneity and discriminatory accuracy (MAIHDA). Specifically, we apply logistic MAIHDA. The study has three interrelated aims:
(1) To examine how much of the variation in violence victimisation is attributable to the differences between intersectional strata defined by the combination of gender, ethnicity, socioeconomic status (SES), age and disability;
(2) To assess whether observed inequalities across these strata are primarily additive (reflecting the main effects of social locations) or whether there is evidence of statistically significant intersectional interaction effects, as indicated by the proportion of stratum-level residual variance remaining after accounting for additive fixed effects; and
(3) To map patterns of risk and determining how the risk varies across violence types (e.g. if a stratum is high risk for one and low risk for another).
The findings of the present study contribute to understanding the structural and systemic dynamics shaping violence victimisation in England and Wales, and to informing policies aimed at tackling intersecting systems of oppression such as sexism, racism, classism, agism and disablism.
2Literature review
Intersectionality was introduced as a theoretical framework and research method by
Crenshaw (1989,
1991) in her ground-breaking work on black women’s experiences in legal, social and justice systems in the United States of America (USA), though scholars acknowledge its earlier heritage in black feminist research (
Potter, 2015). It provides a novel approach to ‘understanding and analysing the complexity in the world, in people, and in human experiences’ (
Collins and Bilge, 2020: 2) by considering the multiplicative ways in which identities come together, and the impact of social systems of power and oppression on them. Examining power relations is a necessary component of intersectionality work (
Healy, 2024), without which intersectionality risks being nothing more than a ‘buzzword’ (
Davis, 2008).
Potter (2015) rightly contends that intersectionality is a natural fit for researching experiences of crime and victimisation, given its focus on interactive identities, hierarchies of power, oppression and inequalities.
Healy and Colliver (2022) however note there is a lack of criminological intersectional research and analysis, despite substantial evidence that race, gender and class substantially impacts on people’s experiences of the criminal justice system. In addition, individual impairments and disability significantly increase risk of victimisation, particularly for disabled women (
Ballan et al., 2014;
Díaz-Faes et al., 2023;
Healy, 2021). Hence, individual experiences as victims of crime can be understood better in terms of how ethnicity/race, gender, socioeconomic status, disability and other identities/positionalities intersect. The present paper therefore complements an emerging body of quantitative criminological research investigating intersectional inequalities (e.g.
Pina-Sánchez and Tura, 2024;
Tura et al., 2025).
There is evidence of the benefits of applying an intersectional lens to the study of violence victimisation as previous research found that disabled women are at greater risk of domestic abuse victimisation than disabled men and non-disabled women, and are also at greater risk of sexual violence, sexual assault and stalking (
Balderston, 2013;
Healy, 2021;
Hughes et al., 2012;
McCarthy, 2017;
Pettitt et al., 2013;
Thiara and Hague, 2013;
Williams and Tregidga, 2014). In a quantitative intersectional study using national longitudinal data in the USA,
Bones (2013) found increased risk of violent and sexual victimisation for disabled women, particularly those of lower incomes. There is less research on disabled men, though what exists suggest they are at higher risk of violent victimisation than non-disabled men (
Cohen et al., 2006;
Hahn et al., 2014;
Sikweyiya et al., 2022).
Mueller et al. (2019) explored how violence is patterned at the intersections of race and disability in the USA. They identified how racism and ableism combined to increase the risk of violence towards black and brown communities (see also
Castillo, 2024). Further research by
Kattari et al. (2021) found intersections of gender identity and disability significantly increased the risk of victimisation within healthcare settings in the USA, with similar findings by
Fredriksen-Goldsen et al. (2014).
Díaz-Faes et al. (2023) found that individuals with intellectual disabilities living in Spain were four times more likely to become poly-victims (victimised repeatedly).
Fundamentally, an intersectional approach enables researchers to consider how complex positionalities within interlocking social processes and systems of oppression create (potentially unique) risk profiles. While men are more likely to experience victimisation than women when all types of victimisations are combined, differentiating by violence type/source shows that women are more likely to experience intimate partner violence and disabled women experience higher rates of victimisation than disabled men, highlighting the contribution of intersectionality to victim research (
Bones, 2013). Furthermore, conceptualisations of violence are also dependent on social relationships, institutions and culture (
Goodley and Runswick-Cole, 2011), including who is defined within group identities. Intersectionality provides an opportunity for understanding ‘the multiple ways in which prejudice and violence might be experienced’ (
Mason-Bish, 2015: 25) and hence offers an opportunity for informing improved targeting of resources to address violent victimisation.
Criticisms of intersectionality in quantitative research have suggested that many researchers fail to define or explicate what intersectionality is and its role in challenging social power (
Bauer et al., 2021).
Beccia et al. (2021) suggest there is a lack of engagement on structural level constructs such as power and oppression and that many studies are considered too simplistic, using basic statistical analytical techniques, relying on descriptive statistics, regression with interactions, or stratified analyses. This paper addresses these flaws by positioning intersectionality in theoretical and methodological terms. It recognises that social positions are hierarchical and reflective of power; hence experiences at the individual level are often reflected in systemic and structural levels, such as through racism, classism, sexism and disablism. Furthermore, it utilises MAIHDA (
Evans et al., 2024) as a method of examining quantitative data in an intersectional (as opposed to additive) manner. Therefore, the present paper is the first study of its kind to use MAIHDA to examine intersectional inequalities in experiencing three types of violence: stranger, acquaintance and domestic in England and Wales.
Methods
Data source
We combined 5 years of data from the Crime Survey for England and Wales (CSEW) covering the period April 2015 to March 2020 (
Office for National Statistics, 2021a,
2021b,
2021c,
2022a,
2023), resulting in a total sample of 165, 661 adult respondents. These data include all individuals aged 16 and over who were asked about experiences of violence victimisation and had complete responses for all variables used to define intersectional strata (gender, age, ethnicity, socioeconomic status and disability – see below). The yearly breakdown of the sample is as follows: 2015/16 (n = 33,863; 20.4%), 2016/17 (n = 33,842; 20.4%), 2017/18 (n = 33,035; 19.9%), 2018/19 (n = 2,733; 19.8%) and 2019/20 (n = 32,188; 19.4%). There were no missing values on the key variables used in the analysis, so no imputation or case-wise deletion was necessary (see Online Supplemental Appendix Figure 1).
The CSEW is a nationwide face to face crime survey which employs a stratified multistage cross-section sample design to ask household residents about their experiences of a range of crimes in the 12 months immediately prior to the survey. This enables the recruitment of a representative sample of the adult population (16 years or older) living in private accommodation in England and Wales in each year. However, the CSEW ‘does not cover the population living in group residences (for example, care homes or student halls of residence) or other institutions, nor does it cover crime against commercial or public sector bodies’ (
ONS, 2024d). Implications of this limitation are discussed further below.
The CSEW questionnaire for the adult survey has a complex structure, consisting of a set of core modules (e.g. crime screener questionnaire) asked of the whole sample, a set of modules asked only of random sub-samples (e.g. performance and experiences of the Criminal Justice System), victimisation module completed only by victims and self-completion modules completed by those who are 16- to 74-year-olds (e.g. victims of domestic violence, sexual victimisation and stalking; 16- to 59-year-old prior to October 2016). The crime screener questionnaire is administered to the entire sample and asks whether respondents have experienced certain types of crimes or incidents within the last 12 months. All incidents identified at the screener questionnaire are followed up in more detail in the victimisation module (
Ganpat et al., 2022;
Tseloni and Tilley, 2016). The screener questionnaire data was analysed for this paper, as it reflects the frequency of violence victimisation among the entire sample.
Outcome variables
There are three binary dependent variables used in the analysis: stranger violence (0 = no incidents, 1 = 1 or more incidents), acquaintance violence (0 = no incidents, 1 = 1 or more incidents) and domestic violence (0 = no incidents, 1 = 1 or more incidents). The definitions of these victimisation types were given in the Introduction section. However, sexual and domestic violence experiences are considered under-reported as ‘many victims will not be willing to disclose these incidents in an in-home, face-to-face personal interview’ (
ONS, 2024). Therefore, the results for domestic violence in this paper should be read with caution.
Dimensions of social strata
To create contexts or intersectional social strata, five categorical social identities/positions were used: sex, ethnicity, age, socioeconomic status (SES) and disability. Sex was measured dichotomously with categories of (1) female and (2) male. Ethnicity is a categorical variable with four identity-options: (1) White, (2) Asian or Asian British, (3) Black or Black British and (4) Mixed or Chinese or Other. Age is a categorical variable with three categories of (1) 16–24, (2) 25–44 and (3) 45-plus years. SES is a categorical variable with four categorical levels: (1) higher managerial, administrative and professional occupations, (2) intermediate occupations, (3) routine and manual occupations and (4) never worked and long-term unemployed. Finally, disability is a dichotomous variable with categories of (1) no long-standing illness and (2) long-standing illness. For the ethnicity variable, the Mixed and Chinese or Other categories were merged, and for the age variable, 45–64, 65–74 and 74+ categories were merged to increase the sample size for some intersectional strata. Sex was used instead of gender, as this was how the data was recorded in the survey. Full details of variable derivation and coding are available in Online Supplemental Appendix Table 1.
Table 1 presents descriptive statistics for outcome and strata variables.
Constructing the strata ID
To conduct a MAIHDA analysis, a unique ID for each stratum is created. This method sees the data as having two levels: individual respondents (level 1) are treated as nested in the intersectional social strata they belong to (level 2). By treating social strata as the second level, they are proxies for positionalities or ‘contexts’, rather than traits of individuals. This approach allows the analysis of intersectional social strata within a multilevel framework (
Evans et al., 2024).
A total of 192 different intersectional strata were created by combining the two categories of sex, the four categories of ethnicity, the three categories of age, the four categories of SES, and the two categories of disability (i.e. 2 × 4 × 3 × 4 × 2 = 192 strata). One combination was empty (Male, Black or Black British, age 16–24 years, Intermediate SES, Disabled), leaving 191 strata in the analysis. Strata were given unique 5-digit ID codes, with each digit corresponding to one of the five identities. For example, the stratum 23142 includes individuals who are ‘Female (sex = 2), Black (ethnicity = 3), aged 16–24 (age = 1), never worked (SES = 4), with long-standing illness (disability = 2)’. Interested readers can find the description of any specific intersections in Online Supplemental Appendix Table 4.
Statistical analysis
The analysis proceeded in line with the study’s three aims: (1) to examine how much of the variation in violence victimisation is attributable to the differences between intersectional strata; (2) to assess the extent to which inequalities are additive or reflect meaningful intersectional interaction effects; and (3) to examine which strata are most and least at risk across different victimisation models, which help us understand the complexity of risk distribution.
To address Aim 1, we fitted ‘null’ logistic MAIHDA models to investigate violence victimisation across intersectional social strata. In this model, individual observations (level 1, n = 165,661) were nested within 191 intersectional strata (level 2), defined by combinations of gender, ethnicity, age, socioeconomic status (SES) and disability. The model included only random intercepts to allow victimisation risk to vary across strata, enabling the calculation of the Variance Partition Coefficient (VPC;
Goldstein et al., 2002;
Leckie et al., 2020). The VPC quantifies the proportion of total variance in violence victimisation that is attributable to differences between intersectional strata, thereby providing a measure of between-stratum inequality.
To address Aim 2, additive main effects models (or ‘full’ model) were fitted, incorporating the categorical variables defining the strata as main effects predictors with fixed regression coefficients. This model captures two- and higher-way interaction effects between the predictors via the stratum random effect. In addition, the Proportional Change in Variance (PCV) was calculated to assess the relative contributions of additive versus interaction effects (on the log-odds scale). Specifically, the PCV expresses the extent to which the main effects explain the overall variation in mean outcomes between the strata. A PCV meaningfully less than 100% suggests that interaction effects are crucial for accurately characterising observed inequalities between strata, indicating that at least some strata have predicted victimisation rates that substantially depart from those implied by ‘universal’ or general patterns of additive inequalities (
Evans et al., 2024).
To fulfil Aim 3, we used the ‘full’ models to generate predicted probabilities and counts of violence victimisation for each stratum. These were used to rank and compare strata across the three violence types, identifying the strata most and least at risk. Predicted rates were reported as percentages (by multiplying predicted probabilities with 100). Predicted counts were obtained by multiplying the predicted probability by the sample size of each stratum.
All data management and statistical analyses were performed using R (version 4.4.1). All data used in this paper can be accessed via the UK Data Service (
Office for National Statistics, 2021a,
2021b,
2021c,
2022a,
2023) and replication codes are available in Supplementary Materials.
Ethical considerations
Ethical approval was not required for this study as it involved the secondary analysis of anonymised survey data from the Crime Survey for England and Wales (CSEW), which is publicly available via the UK Data Service. The data were accessed and used in accordance with the UK Data Service’s End User Licence, and all relevant sources are cited appropriately.
Results
This section presents findings organised around the study’s three aims: (1) to examine how much of the variation in violence victimisation is attributable to differences between intersectional strata, (2) to assess whether inequalities are mostly additive or reflect meaningful interaction effects and (3) to explore which intersectional strata are most and least at risk, and whether these differ across violence types.
Between-stratum variation in risk (Aim 1)
Table 2 presents results from the null and full logistic MAIHDA models fitted separately for stranger violence, acquaintance violence and domestic violence. The general contextual effect of strata in the null logistic models, measured by the VPC, was 20% for stranger violence, 17% for acquaintance violence and 26% for domestic violence. These VPCs represent the proportion of the total variance in victimisation risk that is attributable to differences between the 191 intersectional strata. This indicates a substantial general contextual effect: individual experiences of violence vary meaningfully based on intersectional social positions.
Additive versus interaction effects (Aim 2)
To evaluate how much of this between-stratum variance is explained by additive main effects, we compared the null and full models. In the full models, we included gender, age, ethnicity, socioeconomic status (SES) and disability as fixed effects. The proportional change in variance (PCV) shows that 98% of the between-stratum variance in stranger violence, 93% in acquaintance violence and 96% in domestic violence is accounted for by these main effects. In other words, only 2% of the between-stratum variance in the stranger model, 7% in the acquaintance model and 4% in the domestic model are attributable to interaction effects after accounting for the additive main effects (see
Table 2). These residuals indicate small but meaningful interaction effects – that is, risk patterns that cannot be reduced to the additive effects of individual social positions (
Evans et al., 2024).
To further address Aim 2, the predicted random effects from the full models across the strata were then plotted to visualise the variability and identify patterns in victimisation risks that are not explained by the main effects alone (
Figure 1 and Online Supplemental Appendix Table 2). Across all three violence types, the predicted random effects were rarely significant. Only stratum 21211 (women, white, aged 25–44, higher managerial, no long-standing illness) experienced lower-than expected stranger and domestic violence. These results suggest that only at one intersection is there statistical evidence that the percentage of individuals experiencing violence differs from what is expected based on the general patterns of additive main effects (on the log-odds scale). However, as
Evans et al. (2024) suggest, the absence of statistical interactions does not indicate the lack meaningful inequalities across social strata, and mapping inequalities intersectionally allows us to examine the extent of the inequalities across multiple social dimensions simultaneously.
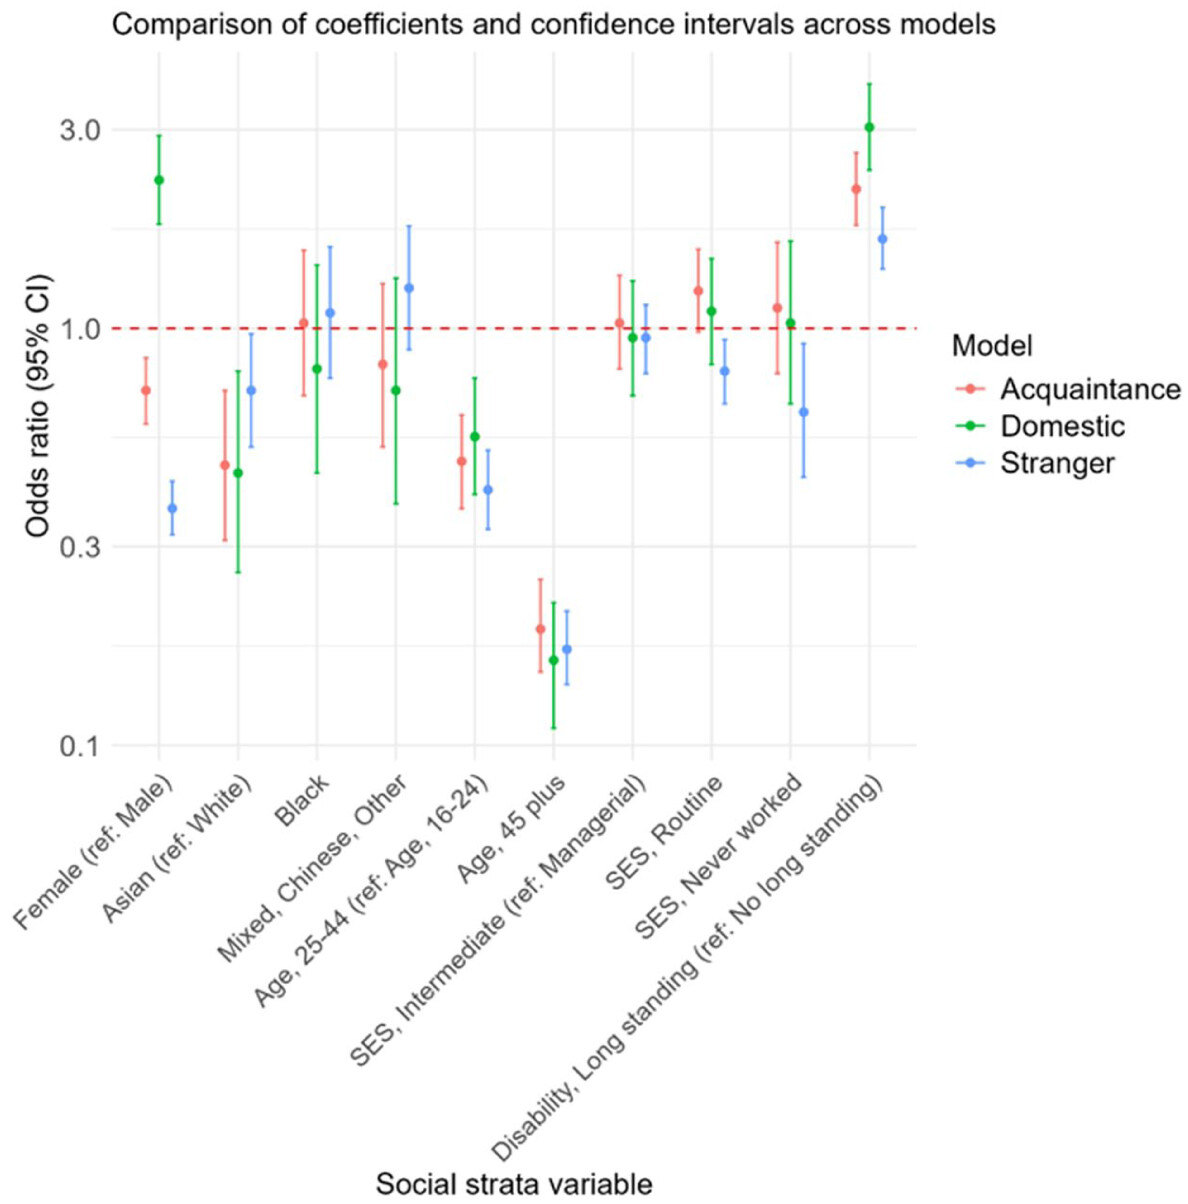
Fixed effect patterns across violence types (Aims 3)
Figure 2 and
Table 2 summarise the main effects. Holding other variables constant, gender, age, ethnicity, SES and disability all show statistically significant relationships with violence victimisation, though the size and direction of effects vary by violence type.
For ‘sex’, women have significantly lower odds of experiencing stranger violence (OR = 0.37, 95% CI: 0.32–0.43) and acquaintance violence (OR = 0.71, 95% CI: 0.59–0.85) compared to men, but substantially higher odds of experiencing domestic violence (OR = 2.27, 95% CI: 1.78–2.90). Ethnicity also plays a crucial role, with Asians having lower odds of experiencing all three types of violence compared to whites, particularly domestic violence (OR = 0.45, 95% CI: 0.26–0.79). Age is another significant factor; individuals aged 25–44 and 45 plus have substantially lower odds of experiencing all types of violence compared to those aged 16–24, with the most pronounced drop observed in domestic violence for those aged 45 plus (OR = 0.16, 95% CI: 0.11–0.22). For socioeconomic status (SES), those with routine occupations and those who have never worked have lower odds of experiencing stranger violence (OR = 0.79, 95% CI: 0.66–0.94) and (OR = 0.63, 95% CI: 0.44–0.92), respectively. Importantly, individuals with long-standing illnesses have significantly higher odds of experiencing all types of violence, with the highest odds observed in domestic violence (OR = 3.04, 95% CI: 2.40–3.86). These findings are visually represented in
Figure 2, which suggests that regression relationships are consistent across violence types, except for sex and to a lesser extent disability.
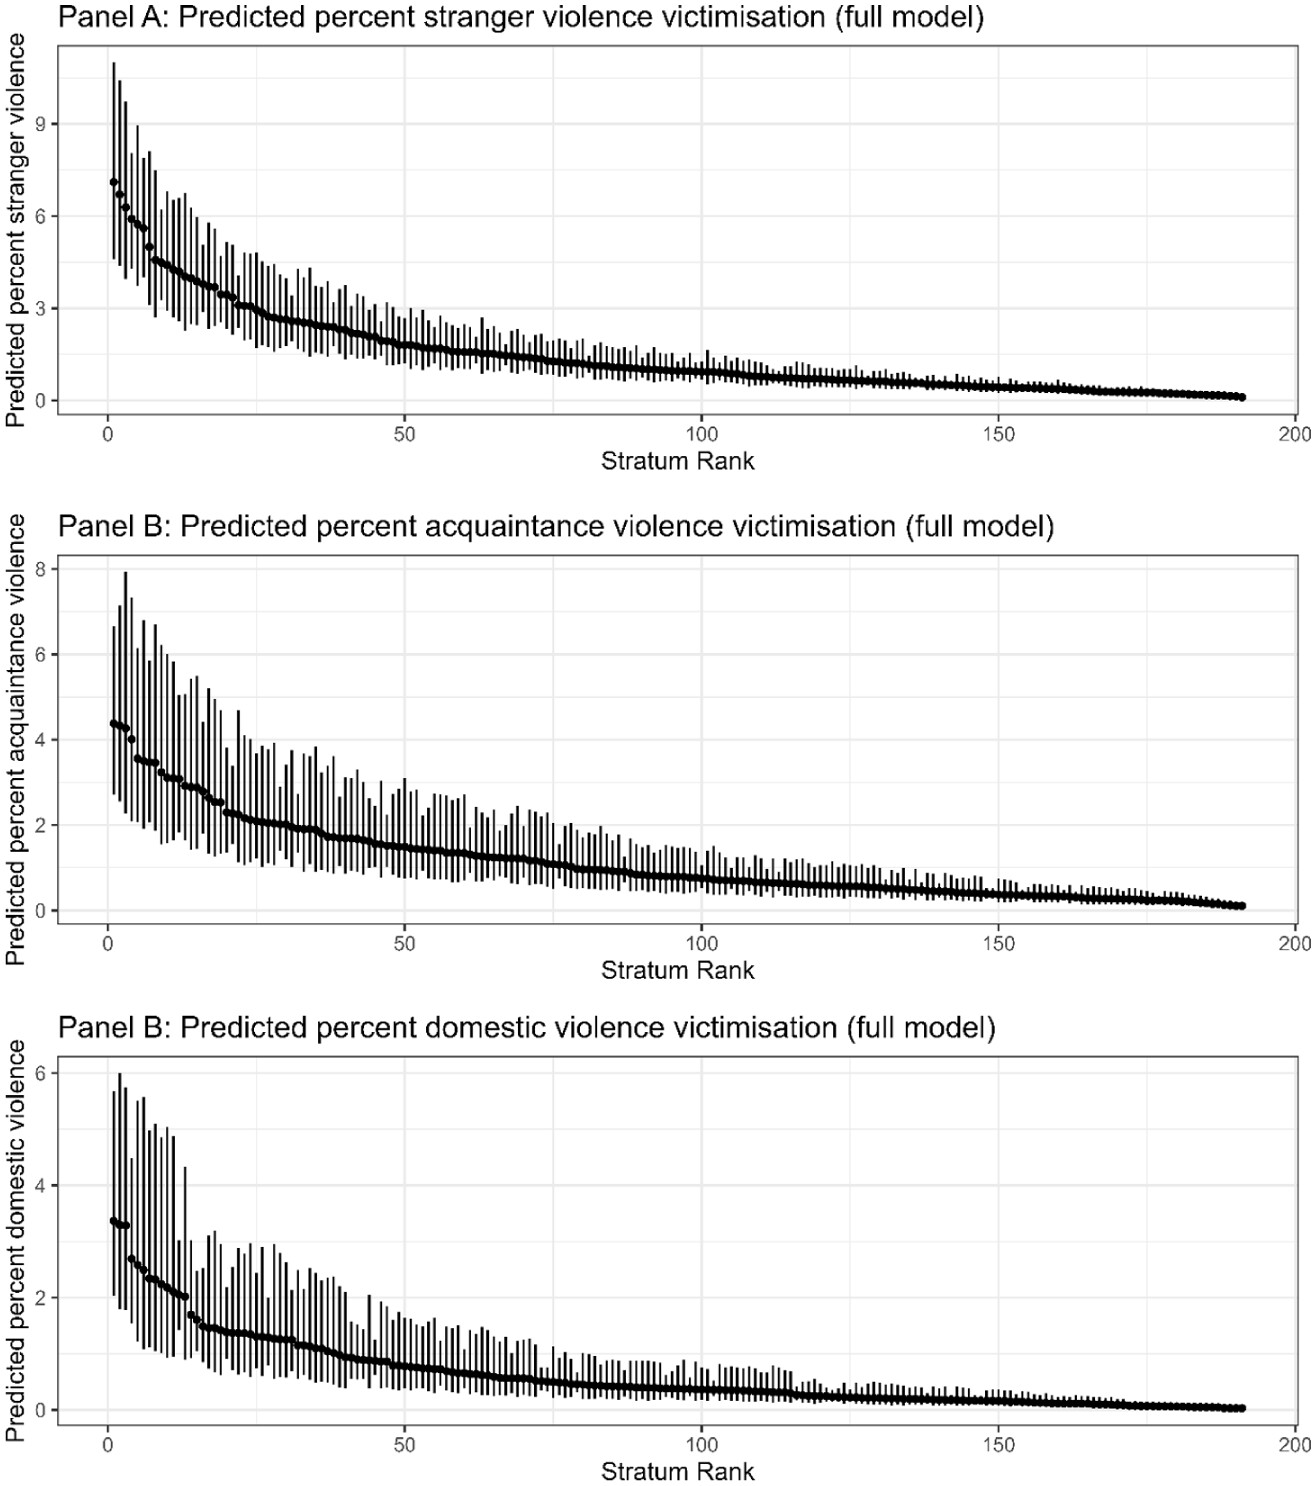
Intersectional patterns in predicted probabilities and strata rankings (Aim 3)
To further explore inequality patterns, the 191 strata were ranked for each outcome based on the predicted probabilities of experiencing stranger, acquaintance and domestic violence (1 = highest; 191 = lowest) and compared across the three models (see
Figure 3 and Online Supplemental Appendix Table 3).
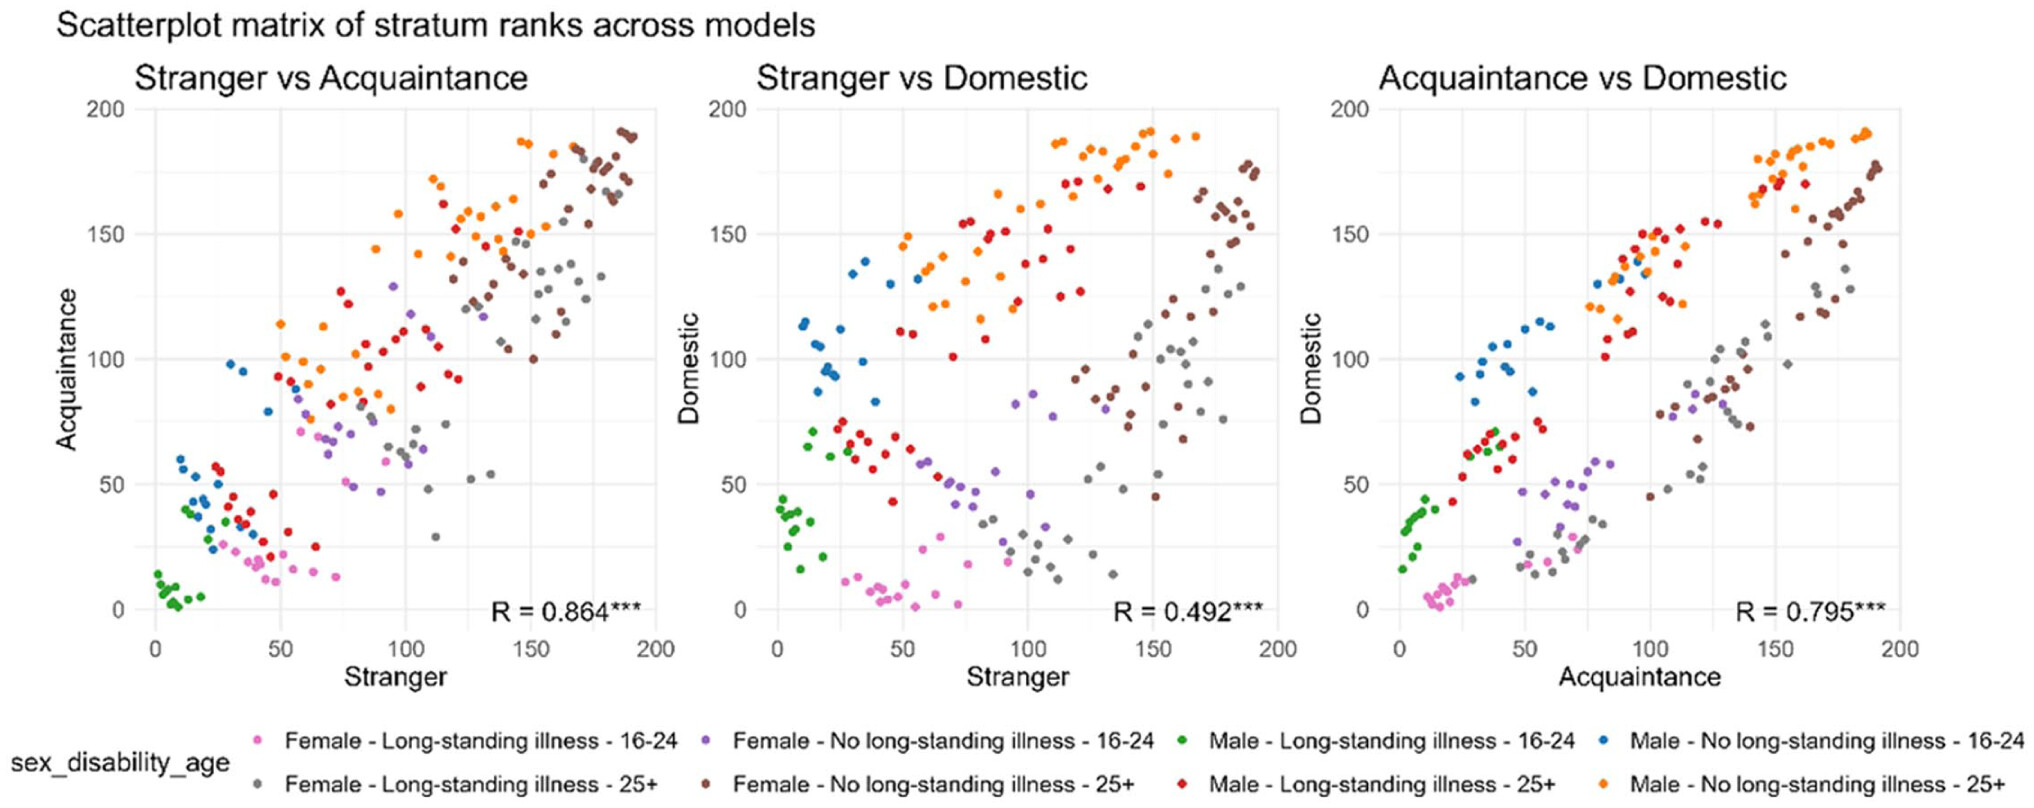
We then conducted a correlation analysis (see
Figure 4) which showed a strong positive correlation between the ranks for acquaintance and domestic violence (R = 0.80). In contrast, the correlation between the ranks for stranger violence and the other two types of violence was moderate (R = 0.49 for stranger vs domestic) to strong (R = 0.86 for stranger vs acquaintance). This suggests that while some strata may rank high for both stranger and acquaintance violence, others may rank high for one type and low for another, highlighting the complex and varied nature of crime victimisation across different groups. Importantly,
Figure 4 shows that young disabled individuals from different ethnic and socioeconomic backgrounds are at a greater risk of experiencing violence.
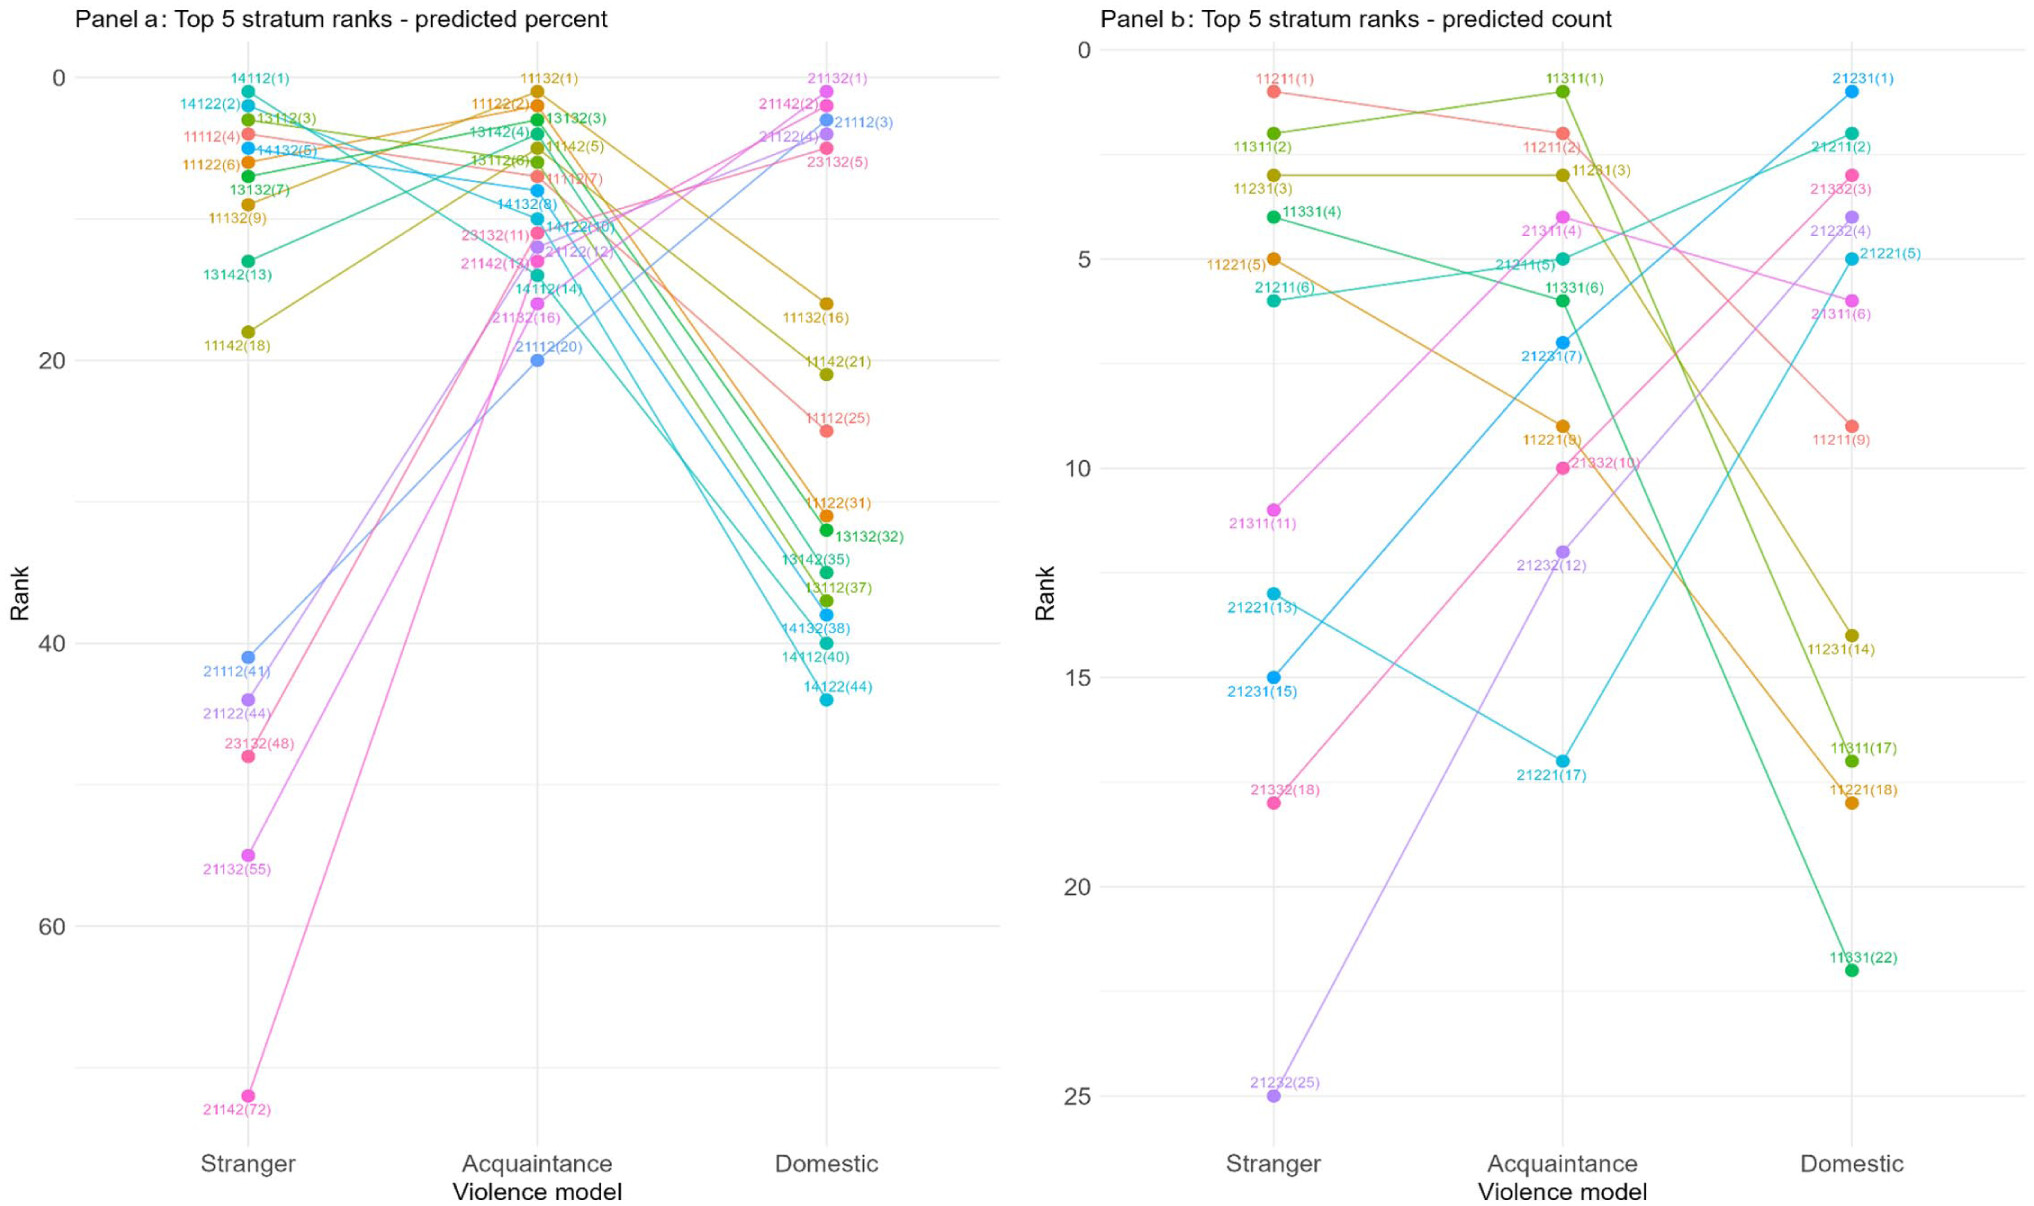
Identifying high- and low-risk strata (Aim 3)
To make this variation more concrete and actionable, the analysis then identified the top 10 strata with the highest and lowest predicted probabilities of victimisation for each type of violence victimisation (stranger, acquaintance and domestic) and their respective random effects (see
Table 3). The ranks of the top five strata with the highest predicted rates of victimisation (
Figure 5 – Panel a) and predicted counts (
Figure 5 – Panel b) were then visually analysed across the models.
The results in the predicted rates figure (Panel a) showed that the top five strata that rank high for stranger violence tend to also rank high for acquaintance violence but not for domestic violence, reinforcing the findings from the correlation matrix analysis above. For example, stratum 14112 (men, mixed or Chinese or Other, aged 16–24, higher managerial and disabled) rank high for stranger violence (rank = 1) and acquaintance violence (rank = 14) but far less high for domestic violence (rank = 44). The top 10 strata for stranger and acquaintance violence consist of young (aged 16–24) disabled men with different ethnic backgrounds and SES status (
Table 3). Conversely, the top five strata that rank high for domestic violence tend to rank low for stranger violence but similarly for acquaintance violence, reinforcing the findings from the correlation matrix analysis above. For example, stratum 21132 (women, white, aged 16–24, routine and manual occupation and disabled) ranks high for domestic violence (rank = 1) and acquaintance violence (rank = 11) but relatively low for stranger violence (rank = 55). Top 10 strata for domestic violence consist of young (aged 16–24) disabled women from mostly white ethnic background (but also black and mixed/Chinese/other) and with various SES status (
Table 3).
The predicted count figure (Panel b), which provides insight into the overall impact within each stratum, show that although men and women still experience the highest rates of stranger and domestic violence, respectively, the strata that rank highest for predicted counts are different. This is because predicted counts consider the size of each stratum, leading to a higher total number of predicted victims in larger strata. The differences between these two metrics are crucial for planning interventions. Strata with high predicted rates of victimisation indicate where individuals are most at risk and may benefit from targeted interventions. In addition, strata with high predicted counts highlight where the overall impact is greatest, guiding resource allocation to manage the broader effects of violence.
Discussion and conclusion
This study set out to examine how intersecting social identities shape people’s (aged 16 or over) experiences of violence, specifically, stranger, acquaintance and domestic violence, using the MAIHDA approach. The analysis produced a number of important findings that help us better understand inequalities in violence victimisation.
Understanding the role of intersectional social positions (Aim 1)
Our first aim was to assess how much of the variation in violence victimisation is shaped by people’s combined social positions. The findings show that a substantial proportion of the variance, ranging from 17% to 26%, depending on violence type, is explained by differences between the 191 intersectional strata. In other words, who you are across multiple social dimensions, gender, ethnicity, socioeconomic status (SES), age and disability, really does matter. This supports long-standing claims from intersectionality scholars that experiences of inequality are not simply the sum of individual identities but are shaped by their intersections (
Evans et al., 2024). These findings underscore the importance of looking beyond single-axis approaches when investigating violence victimisation.
Additive versus interaction effects (Aim 2)
The second aim of the study was to examine whether the inequalities we observed were largely additive–that is, whether they could be explained by individual characteristics–or whether there were also distinct intersectional interaction effects. The statistical models showed that over 90% of the between-stratum variance was explained by the main effects of gender, age, ethnicity, SES and disability. This tells us that most of the inequality in victimisation follows predictable lines, with each variable contributing independently. That said, the small residual variance–representing between 2% and 7% depending on the violence type–suggests there are still subtle but meaningful interaction effects that are not explained by these main effects alone. These patterns, although modest, point to a complexity that would be missed in a standard main effects model. Residual analysis indicated limited interaction effects. However, as
Evans et al. (2024) argue, just because these interaction effects are difficult to detect statistically–particularly given the relatively small numbers within some intersectional strata–this does not mean they are unimportant. In fact, this subtlety highlights why intersectional methods are needed: they allow us to see those nuanced differences in risk that emerge only when identities intersect. This echoes calls from recent literature emphasising the value of intersectional approaches in criminology and victimology, particularly for uncovering how overlapping systems of inequality create layered disadvantage (
Pina-Sánchez and Tura, 2024).
Patterns of risk across violence types and strata (Aim 3)
The third aim was to explore how patterns of risk varied across violence types and to identify which intersectional strata were most and least affected. The fixed effects results show stark differences across violence types, particularly when it comes to gender. Women were significantly more likely to experience domestic violence, which is consistent with extensive prior research that highlight the gendered nature of violence in intimate and domestic contexts (
Balderston, 2013;
Healy, 2021;
Hughes et al., 2012;
McCarthy, 2017;
Pettitt et al., 2013;
Thiara and Hague, 2013;
Williams and Tregidga, 2014). Men, by contrast, were more likely to experience stranger and acquaintance violence, a pattern also well-documented in previous studies. Disability emerged as a consistent and powerful risk factor across all three violence types, particularly for domestic violence. These findings echo earlier research highlighting how disabled people – and disabled women especially – are more vulnerable to violence and abuse (
Bones, 2013;
Cohen et al., 2006;
Hahn et al., 2014;
Sikweyiya et al., 2022). Age also mattered: younger people were more likely to experience all types of violence, confirming long-standing trends in victimisation research (
Semenza et al., 2021).
Looking at the intersectional strata brings these broader patterns into sharper focus. The highest-risk groups for stranger and acquaintance violence were predominantly young disabled men from diverse ethnic and socioeconomic backgrounds. This suggests that vulnerability in public and semi-familiar settings is particularly concentrated in this group, a finding that aligns with prior work examining how age, gender, disability and ethnicity interact to shape violence exposure (
Mueller et al., 2019). In contrast, the highest-risk strata for domestic violence were young disabled women, often from white backgrounds, but also including those from Black and mixed ethnicities. This reflects a pattern of compounded marginalisation and elevated vulnerability in private or domestic settings. As others have argued, disabled women occupy a particularly precarious position at the intersection of gender, disability and often socioeconomic disadvantage (
Healy, 2021;
Hughes et al., 2012). These findings make a strong case for targeted support and prevention strategies that recognise the specific needs of these groups.
Limitations
The present study is not without its limitations. The term ‘disability’ encompasses a wide range of impairments, each with different associated risks. This study does not differentiate between types of disabilities to increase sample sizes for intersectional strata, which may lead to an oversimplification of the risks faced by individuals with different impairments. Future research should consider the specific types of disabilities to provide a more detailed understanding of victimisation risks. Similarly, the sex/gender variable used was binary, meaning the experiences of gender-minority individuals was not analysed, nor was individuals’ religion or sexuality. Due to the strata size issues, some groups were also merged, such as age and ethnicity. The CSEW does not include populations living in group residences such as care homes or student halls of residence, nor does it cover crimes against commercial or public sector bodies. These exclusions mean that the findings may not be generalisable to these populations, potentially underestimating the prevalence of victimisation in these settings. This limitation may affect the findings, particularly the observation that disabled individuals are at higher risk of victimisation, given that disabled people residing in care homes or other group settings were not included in the sample. Therefore, results should be interpreted with caution, acknowledging that they may not fully represent the experiences of disabled people in group residences. Finally, domestic violence reports in the interviewer-led sections of the CSEW are prone to significant under-reporting, which can lead to an underestimation of the true prevalence of domestic violence, and there will be intersectional patterning to this too. These limitations highlight the need for cautious interpretation of the findings in relation to domestic violence victimisation and suggest areas for improvement in future research. Addressing these issues can help provide a more accurate and comprehensive understanding of the intersectional disparities in experiencing violence.
Implications for policy and practice
The results have significant policy implications, suggesting the need for targeted interventions and resource allocation to address the specific risks of various groups. Policymakers could develop specialised programmes and legislation to protect young disabled individuals from the types of violence they are most at risk for, ensuring a more tailored and effective approach to violence prevention. In practice, these findings highlight the importance of training for professionals such as social workers, healthcare providers and law enforcement to recognise and address the distinct types of violence faced by young disabled men and women. In addition, the development of specialised support services and community programmes can provide the necessary resources and education to prevent violence and support victims. Future research should focus on understanding the underlying causes of these patterns and evaluating the effectiveness of targeted interventions over time, potentially through longitudinal and interdisciplinary studies.
Conclusion
Overall, this quantitative intersectionality analysis highlights those at greatest risk of violence victimisation, enabling policy and policing to target/respond more effectively, and also draws attention to the differences and power dynamics that contribute to the increased targeting of marginalised groups in an unjust and unequal society. The systemic and structural marginalisation of disabled men and women is evident, but an intersectional methodology draws attention to the unique experiences of disabled people, who face multiple layers of oppression and occupy a liminal space within both categories of identity. Structural and symbolic forms of oppression and violence are reproduced and enacted in the everyday violence that disabled women and men experience, whether perpetrated by strangers, acquaintances, or family members.