Introduction
Track and field athletics comprise numerous events, each requiring specific strength and power characteristics. Sprinters and high jumpers require the ability to produce high force and power output.
1,2 The ability to generate high levels of force and power has been identified as the most important contributor to sprint success.
3 Vertical jumps, such as countermovement jumps (CMJs), are a simple and effective means to monitor power output from an individual.
4,5 The short durations of these jumps have made them a popular tool to quantify the explosive capabilities of an athlete to assess asymmetry in performance and scientific research.
5–9 In particular, vertical jump performance is of interest to strength and conditioning coaches, allowing them to monitor an athlete’s neuromuscular status (i.e. supercompensation effects from training intervention and fatigue) and power progression with minimal disruption to the training program.
6Various parameters to assess the performance of CMJ may be derived from force plate data and the resulting force/power/velocity-time curves.
10,11 Impulse measurement and rate of force development (RFD) have been explored as a potential indicator of CMJ performance, although the evidence is inconclusive. For example, Ferragut et al.
12 reported a strong positive relationship between positive impulse and jump height, whilst other studies found only a weak relationship or no relationship at all.
4,13 Similarly, for peak RFD, studies have reported a strong positive relationship with jump height,
14,15 whilst others found only a weak relationship or no relationship at all.
12,16 These contradicting results may be attributed to the poor reliability of RFD parameters evaluated from force plate data during CMJs.
3,14 RFD parameters are reported to have very poor reliability and were, therefore, excluded from this study.
14For male sprinters, there is a significant, widely documented relationship between jump performance (CMJ height), peak power and time to 5, 10, 60, 100 and 300 m.
17–21 Markström and Olsson
19 found very little difference in CMJ performance between sprinters and jump athletes. It is noted, however, that their jump group contained a mix of high jumpers and triple jumpers rather than a single discipline. Furthermore, studies have predominantly focused on male athletes and covered a diverse range of sports and training histories.
6 Typically, males jump approximately 25% higher than females, reportedly due to differences in muscular structure. This muscular structure allows males to produce higher relative forces, however, temporal jump parameters remain similar for the two genders.
22,23 Within the wider jump literature, these differences between genders have been documented, but the knowledge regarding jump performance for female athletes remains limited.
18,22–24The most effective measure of CMJ performance is jump height and a large volume of research has investigated the relationship between jump height and derived take-off parameters.
6 The reviewed literature reported a very strong positive correlation (
r > 0.80) between peak power and jump height.
4,13,16,25 Peak force has been found to have a moderate to strong positive correlation with jump height (
r = 0.52–0.82).
13,14,16 More recently, Souza et al.
5 examined the reliability of CMJ measurements. The study found that peak force had the best reliability scores (
r = 0.99), as well as jump height (
r = 0.94), although the study was conducted with non-elite athletes. Although peak force was a more reliable measure, the authors also note that monitoring jump height has practical benefits for sports involving jumping,
5 however, less is known about the jump performance of other track and field athletes and how this relates to event performance.
Based on the identified gaps in knowledge in CMJ performance for elite track and field athletes, the purpose of this study was threefold: (1) to compare CMJ performance between elite sprinters and high jumpers; (2) to compare CMJ performance between elite male and female athletes in these two events and (3) to determine which CMJ take-off parameters correlated most strongly with jump height. It was hypothesised that the sprinters and high jumpers would generate similar CMJ parameters, including jump height. It was further hypothesised that: (i) the male athletes would jump higher and exhibit greater (body weight normalised) forces and powers during take-off compared with female athletes and (ii) the temporal parameters would not differ. Finally, it was hypothesised that peak power would correlate most strongly with jump height for all athletes.
Methods
A between subject research study design was utilised to address the research gaps and hypotheses developed from the literature review. For the study, male and female elite athlete participants were recruited. The independent variables were gender and discipline, while the dependent variables to be measured included jump height and force platform data (detailed in
Table 2). Athletes were instructed to conduct their usual warm up for a regular training session. Following the warm up, athletes performed three maximal CMJ trials from a standing start position. All the athletes were used to performing CMJs in training. However, three practice jumps, rather than just one, were included to ensure that each athlete was comfortable performing the movement on the force plates, as well as for the investigator to ensure the athlete was performing the CMJ correctly. Athletes stood with one foot on each force plate and their hands on their waist. They were instructed to stand stationary for 2 s to allow their body weight to be determined.
11 Athletes were then instructed to perform a CMJ for maximum height, keeping their hands on their waist during the jump. To reduce the risk of fatigue, a minimum of 2 min rest was allowed between jumps.
Subjects
Ethical approval for the study was obtained from the Loughborough University Ethical Advisory Committee. All participants were informed of the benefits and risks of participating. They completed and signed the informed consent forms prior to participation. Twenty-seven elite athletes, 14 males and 13 females, volunteered to participate (
Table 1). Athletes specialising in sprinting (100 m (F = 4, M = 6) and 200 m (F = 3, M = 3)) and high jumping disciplines were selected due to their availability for testing and familiarity with CMJ. The participants had a range of years of experience in their disciplines: high jumpers (F = 5.8 ± 1.8, M = 6.6 ± 2.3), sprinting (F = 6.7 ± 2.1, M = 4.8 ± 3). All participants had competed at the international level; however, competition results were not disclosed (under 18 through to senior). Participants had been injury free in the 3 months prior to testing.
Data analysis
The statistical parametric mapping (SPM) analysis was performed in MATLAB, while all remaining statistical analyses were performed using IBM SPSS statistics package 22 (SPSS, Chicago, IL, USA) and Python.
26 Significance for the study was set at
p < 0.05. The force plate data were post-processed using a custom program (MATLAB, MathWorks Inc., Natick, MA, USA). Raw force data were filtered using a low-pass Butterworth filter with a cut-off frequency of 40 Hz (frequency determined from raw data using the method presented in a study by Winter
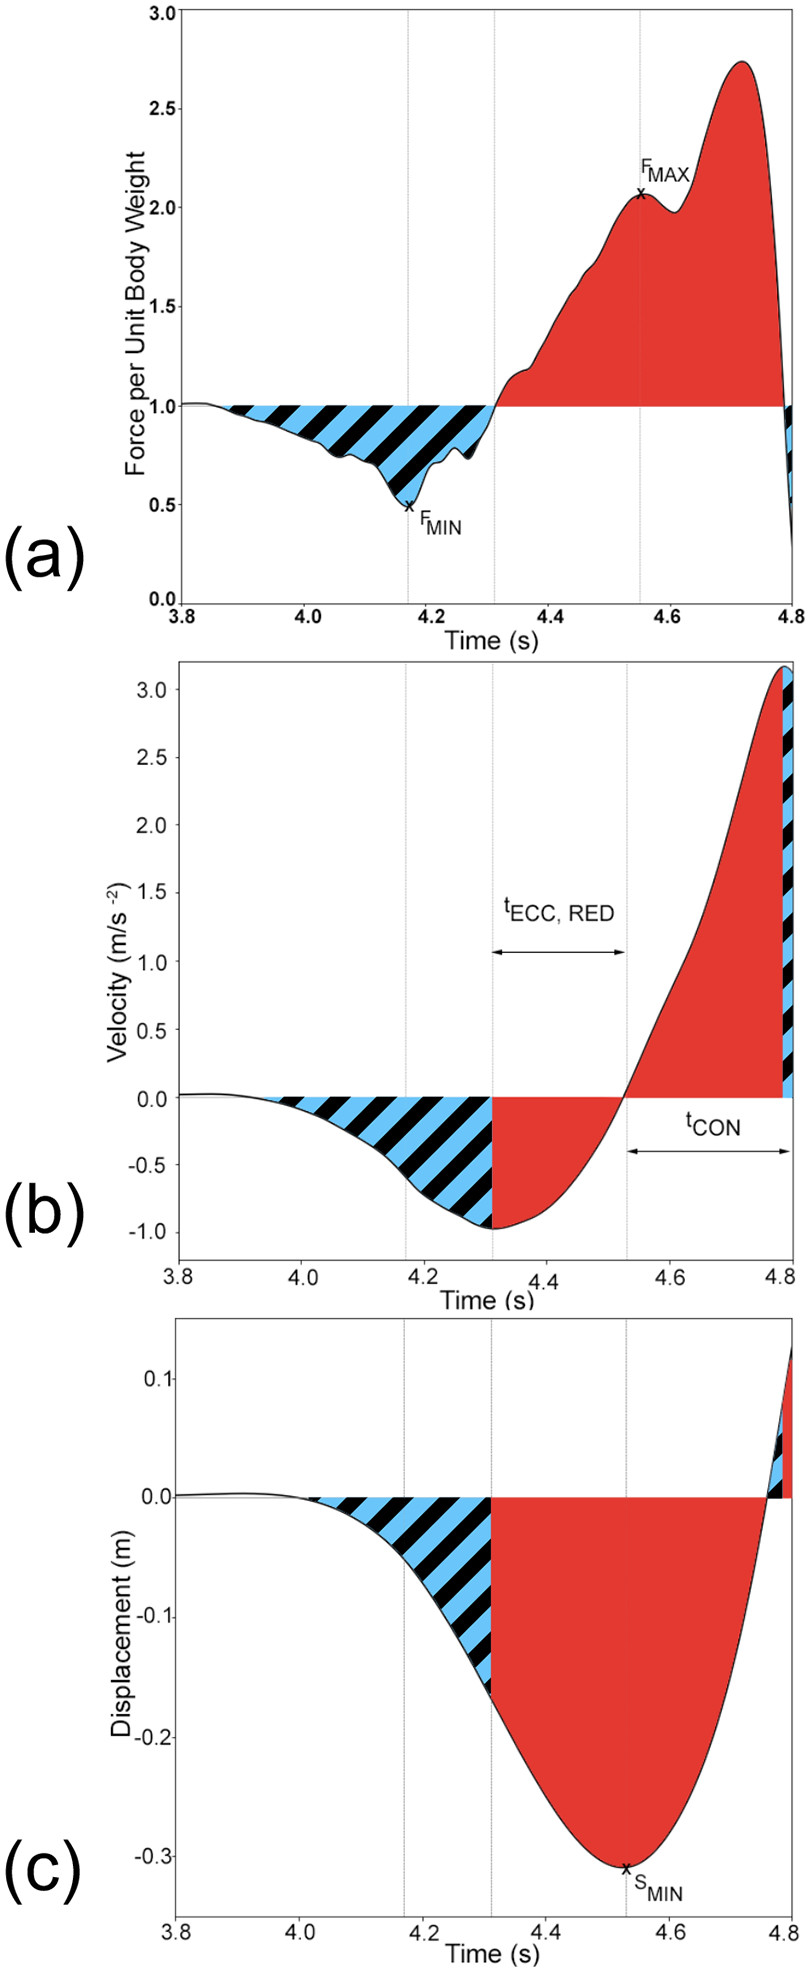
27). The start of the jump was defined as the point where the vertical force first dropped below 98% of body weight. Vertical velocity and displacement were then determined through integration and double integration, respectively, of acceleration data. Take-off was defined as the instant when the vertical force first fell below 10 N. Jump height (JH) was determined from vertical velocity at take-off. All force and power parameters were normalised to body weight and displacement was normalised to standing height. In addition to jump height, ten jump parameters associated with this preparatory phase were evaluated (
Table 2 and
Figure 1). Finally, to allow further comparison between jumps, the time series data from the start of the jump to the concentric phase were interpolated to 1001 points. All force and power parameters were normalised to body weight and displacement was normalised to standing height. Maximum power in Watts was calculated using
equation (1):
where = mass (kg), a = acceleration (ms−2), v= velocity (ms−1), and = Peak power (W) prior to take-off (TO) automatically derived within MATLAB.
The best jump for each athlete, defined as the one with the greatest jump height, was selected as input to the statistical analysis. Descriptive statistics (i.e. mean and standard deviation) were calculated for each jump parameter. The Shapiro-Wilk and Levene Tests were used to test for normality and homoscedasticity of the data, which resulted in subsequent statistical analysis employing non-parametric tests. To compare jump performance between athlete event groups and genders, a Scheirer-Ray-Hare Test was used on jump height and the 10 jump parameters. Cohen’s
d effect sizes (ES) were calculated where significant differences were identified. An ES of 0–0.2 was considered trivial, 0.2–0.6 small, 0.6–1.2 moderate and 1.2–2.0 large.
28 In addition, SPM was used to compare the interpolated time series data (i.e. force, power and displacement) from the entire take-off period between athlete event groups and genders.
29 To test for relationships between jump height and each of the ten jump parameters, Spearman’s rank correlation (r
S) was used. The strength of the correlation was classified as the following: absolute value = 0.0–0.2 very weak, 0.2–0.4 weak, 0.4–0.6 moderate, 0.6–0.8 strong, 0.8–1.0 very strong.
30Results
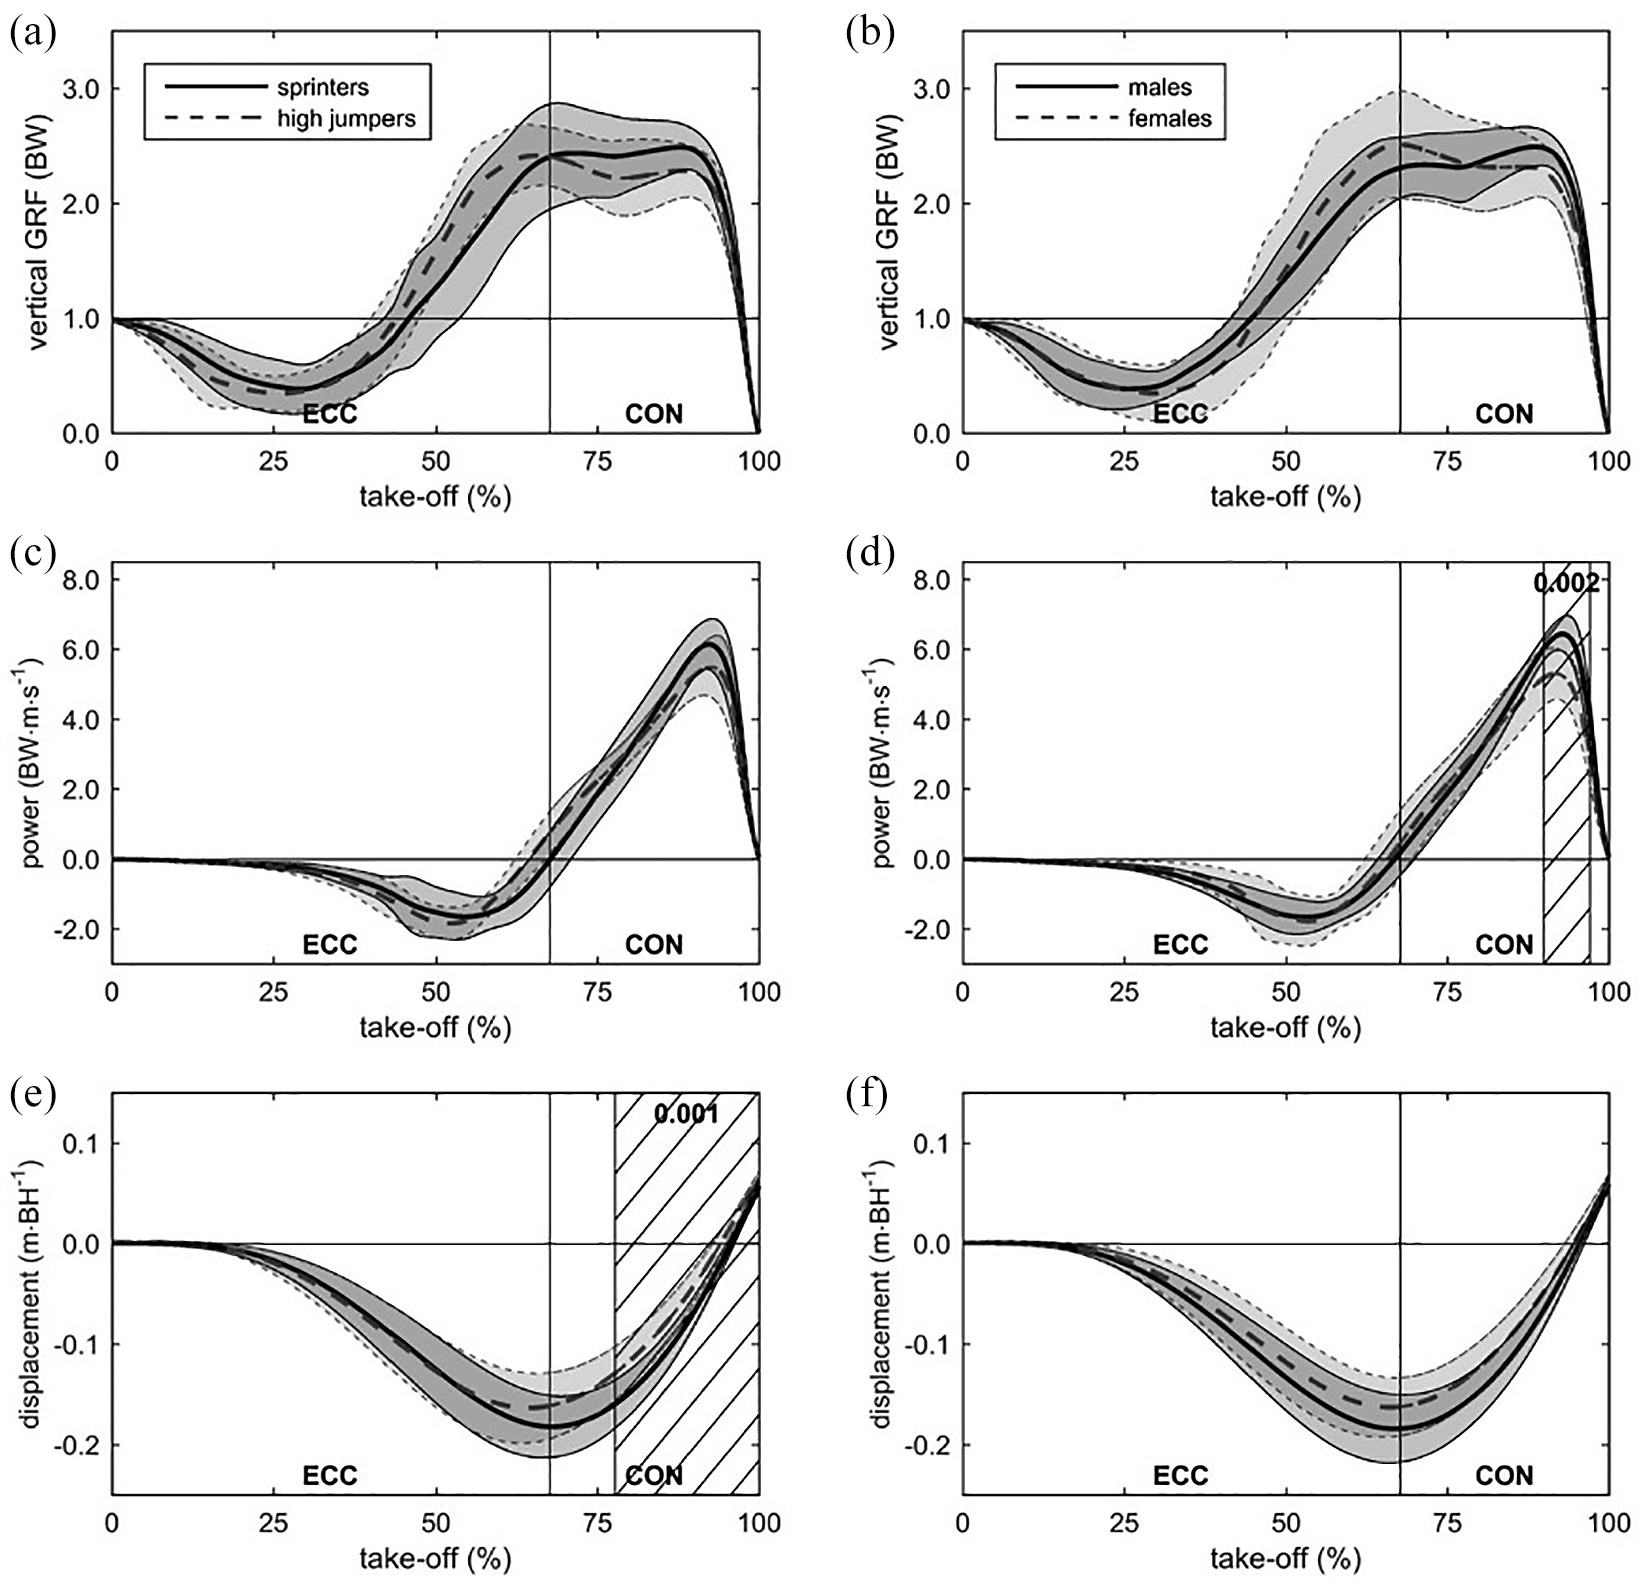
There were no significant differences between the elite sprinters and high jumpers in either jump height or the ten jump parameters (
Table 3). However, the time series analysis revealed differences in centre of mass position during the concentric phase immediately prior to take-off (
Figure 2). The elite sprinters maintained a significantly lower centre of mass position (
p = 0.001) compared with the elite high jumpers, although the two converged toward the instant of take-off.
The elite male athletes jumped significantly higher (by 24.2%) than the elite female athletes (0.451 ± 0.057 m vs 0.351 ± 0.052 m;
p < 0.001; large ES) (
Table 3). The elite male athletes also had significantly higher (body weight normalised) peak power (by 17.9%;
p = 0.002; large ES) and longer eccentric deceleration phase (17.4%;
p = 0.035; moderate ES). The time series analysis reinforced the increased peak power for the elite male athletes (
p = 0.002) compared with the elite female athletes (
Figure 2).
Jump height was very strongly correlated with peak power (r
S = 0.901,
p < 0.001) and very strongly or strongly correlated with positive impulse (r
S = 0.821,
p < 0.001), minimum centre of mass position (r
S = −0.667,
p < 0.001) and mean concentric phase centre of mass position (r
S = −0.747,
p < 0.001). Regarding temporal variables, jump height was only weakly correlated with eccentric deceleration time (rs = 0.396,
p = 0.042) (
Table 4).
Discussion
The first hypothesis, that the elite sprinters and high jumpers would generate similar results across all CMJ parameters, was generally supported. The only difference between the two groups was that the elite sprinters kept their centre of mass position lower (relative to standing) during the latter concentric phase toward take-off. This observation was noted for both genders. The second hypothesis, that the elite males and females would differ in jump height, as well as body weight normalised forces and powers rather than the temporal variables, was partially supported. The elite male athletes jumped significantly higher and generated significantly higher peak power, but there was no difference in the force parameters. The elite male athletes spent a longer time in the eccentric deceleration phase. The third hypothesis, that peak power would correlate most strongly with jump height, was fully supported with the correlation classified as very strong (rS = 0.905).
The between event CMJ parameter results were in agreement with Markström and Olsson
19 who also found no significant differences between elite male sprinters and jumpers. To the author’s knowledge, there is no directly comparable literature including female track and field athletes and, therefore, the current results provide a relevant addition to the existing literature. Despite the lack of difference in jump parameters, the time series analysis indicated that the sprinters maintained a significantly lower centre of mass position during the latter concentric phase compared to the high jumpers. This may be related to the more flexed lower body configuration in the explosive first step of a sprint start compared with the take-off step in high jump.
31,32 A similar outcome was reported by Laffaye et al.
23 based on principal component analysis of CMJ time series data for elite athletes from four team sports (American football, basketball, baseball and volleyball). The results of the study and the body of literature indicate the possible existence of event-specific signatures in elite athletes’ CMJ performance, which highlights the importance of considering event discipline in assessment of CMJ to aid coaches and trainers in developing more relevant training programs.
The increased jump height for the elite male athletes compared with the elite female athletes observed here (24.2% or 10 cm) was slightly less than previously reported in the literature regarding elite/college level athletes across a range of sports (26.4%
23), recreational college athletes (30.8%
18) and untrained individuals (31.2%
22). The increased peak power determined in the present study (17.9%) was similar to that reported for college athletes from a range of sports (20.4%
23) and untrained individuals (17.6%
22). In contrast to Laffaye et al.,
23 this study found no difference in mean concentric force between elite male and elite female athletes. In contrast with previous studies that reported no temporal differences between males and females in CMJs, in this study, elite male athletes spent on average 17.4% (30 ms) longer in the eccentric deceleration phase when compared with elite female athletes. The results of the present study suggest that differences in CMJ height between males and females may decrease as the performance level of the athletes increase. This may be, in part, due to elite female athletes modulating the temporal characteristics of the jump.
Maximal jump height is achieved through maximising centre of mass velocity at take-off and, when measured from standing, the centre of mass position at take-off.
33 Maximizing centre of mass velocity at take-off equates to maximising net impulse, typically through increasing mean concentric force and/or minimising eccentric time.
23 Furthermore, evidence suggests that the strength and power of an athlete influences jump performance more so than technique.
4,34 In support of this, strength and power based training intervention studies have demonstrated improved CMJ performance principally through an increased countermovement magnitude and eccentric lower-limb stiffness,
35 in addition to maintaining high concentric forces for longer periods of time, leading to higher peak powers.
36The inter-subject correlation results from this study generally support these observations. Similarly, the very strong relationship between jump height and positive impulse has also been reported previously.
4,12,13 The results of the present study support these positive correlations; however, it is noted that this may be a result of combining the male and female results across disciplines. Additionally, a recent study by Linthorne suggested that the relationship between jump height and peak power may be artificially inflated.
9 In addition, Linthorne also suggested that this relationship is not a direct cause-effect relationship and may not be the most relevant variable for assessing athletes from a neuromuscular perspective.
9 However, the use of jump height was considered relevant to sports involving jumping and is commonly utilised to assess CMJ performance.
5Strong relationships between jump height and both minimum and mean concentric centre of mass positions have not been reported previously within correlational studies, but these findings do fit with the aforementioned strength and power training intervention studies.
36 The current findings do not support those of Laffaye et al.
23 with respect to the importance of maximising mean concentric force and minimising eccentric time to maximise jump height. However, those authors investigated a more diverse athlete population comprising four different team sports, which may have contributed to the difference in findings.
Limitations
A limitation of the study was the small sample size for each group (total = 27, group
n = 5–9) due to the focus on (internationally) elite athletes, which inherently limits the sampling population compared with studies focused on non-elite level athletes or larger groups in team-based sports. However, every athlete conducted CMJs regularly within their training program and demonstrated high consistency in their three jump performances (the mean coefficient of variation in jump height was 2.5 ± 1.1%), which both lend support to the validity of the current findings. Elite athletes from sprint and high jump disciplines were available for the research study, but the authors acknowledge that this group of athletes from only two sports may limit the generalisability of results. Although the results contribute to the wider body of research, further studies are required to assess whether similar results would be observed in additional disciplines. A further limitation is that not all jump related parameters can be measured with good reliability. While peak values (i.e. power, force and velocity) tend to show very good reliability, the mean and temporal values tend to show poorer reliability.
3 Ultimately, while these limitations are unlikely to have impacted the main outcomes of this study, they may have limited the ability to identify differences or correlations in some of the jump parameters analysed.
Conclusion
To conclude, this is the first study to investigate and compare CMJ performance between elite male and elite female sprinters and high jumpers. The first key outcome was the lack of difference in jump performance parameters between the sprinters and high jumpers, despite evidence that sprinters maintained a significantly lower centre of mass position during the latter concentric phase of the take-off. The second key outcome was that the male athletes jumped significantly higher than the female athletes, however, the difference was less than that reported for lower level athletes. Finally, this study confirmed the strong positive correlation between jump height, peak power and positive impulse, in addition to identifying strong (negative) correlations between jump height and both minimum and mean concentric centre of mass position. In combination, these results provide evidence for the use of CMJ performance as a simple means to assess peak power. The results suggest that CMJ measures need to account for the gender, experience and sporting history of the athlete.