Intended for healthcare professionals
Open access
Research article
First published online May 19, 2023

Flame dynamics of an injection element operated with LOX/H2, LOX/CNG and LOX/LNG in a sub- and supercritical rocket combustor with large optical access

Abstract

Hot fire tests were performed using a single-injector research combustor featuring a large optical access window (255×38 mm) for flame visualisation. Three test campaigns were conducted with the propellant combination of liquid oxygen and hydrogen, liquid oxygen and compressed-natural-gas, as well as liquid oxygen and liquefied-natural-gas at conditions relevant for main- and upper-stage rocket engines. The large optical access enabled synchronised flame imaging using ultraviolet and blue radiation wavelengths covering a large portion of the combustion chamber for various sets of sub- and supercritical operating conditions. Combined with temperature, pressure and unsteady pressure measurements, this data provides a high-quality basis for the validation of numerical modelling. Flame width, length and opening angle as features describing the flame topology were extracted from the imaging. The suitability of flame imaging using ultraviolet and blue radiation wavelengths as qualitative markers of heat release was evaluated. Two-dimensional distributions of the Rayleigh Index were calculated for intervals with and without high-amplitude, self-excited oscillations of the longitudinal acoustic resonance modes. The calculated Rayleigh Index values properly reflect the thermoacoustic state of the chamber, indicating that both types of imaging may be used for qualitative study of thermoacoustic coupling of high-pressure cryogenic flames.

1. Introduction

Liquid propellant rocket engines (LPREs) are a key technology for space launchers world wide. The liquid oxygen–hydrogen (LOX/H2) propellant combination offers the highest specific impulse among all flown chemical propellants.1,2 The European Ariane 5 and Ariane 6 rely on LOX/H2 rocket engines. Other recent examples include the Japanese LE-9,3 the Russian RD-0146,4 the Chinese YF-77,5 and in the US, the RS-25 for the Space Launch System, the RL-10C, as well as the BE-3.6 The liquid-oxygen/methane (LOX/CH4) combination is predicted to be cheaper and easier to handle than LOX/H2. Hence, there is growing interest in these propellants. Examples of LOX/CH4 engines currently in development are the Japanese LE-8,7 the Chinese TQ-11 and TQ-12, the European Prometheus8 and M-10, as well as the Raptor and BE-4 in the US.
Due to its direct influence on flame anchoring, combustion stability, system pressure and overall performance, the injector design is a crucial element in the development of LPREs. The velocity ratio (VR=uf/uo) and the momentum flux ratio (J=ρfuf2/ρouo2) are non-dimensional numbers describing the shear forces from the velocity difference of the injected propellants and thus the atomisation and mixing. Therefore, they often serve as important design parameters governing the combustion efficiency of an engine.9 Frequently, the injectors are placed in sub-scale experiments to verify the desired performance before implementing into full-scale engines.1019 These experiments can also provide test data to validate CFD tools for use in the design process.
Sub-scale experiments can also be used to assess the thermoacoustic stability characteristics of a particular injector design.20,21 Thermoacoustic instabilities are caused by the coupling of oscillating heat release rate (q˙) with pressure oscillations (p) in the combustion chamber. Instabilities can arise if the Rayleigh criterion is satisfied, which can be expressed as
0TVp(x,t)q˙(x,t)dVdt>0
(1)
Measuring p at the wall of a combustion chamber is relatively straight forward, whereas q˙ cannot be measured directly. In former studies, ultraviolet radiation measurements in the band corresponding to the hydroxyl radical (OH*) have often been used as a marker for heat release rate in sub-scale experiments.2224 The interpretation of such measurements can be complicated by the fact that OH* radiation suffers from high self-absorption at pressures relevant for most engines, resulting in the measured intensities dominated by the emission closest to the observer. Furthermore, at temperatures above 2700 K, OH* emission is dominated by thermal excitation rather than chemiluminescence preventing a direct relation between intensity and q˙. For highly strained flames, the peak temperature in the reaction zone is decreased and thus the latter effect is reduced.25 In contrast, radiation in the blue wavelengths, for example, in the band corresponding to CH* emission, is considered to suffer less from the limitations affecting the OH* emission due to a higher ratio of excited to ground state concentrations for this radical. In addition, a shorter duration of the peak CH* concentration improves the suitability as markers for time-resolved heat release26 under such conditions and can complement OH* measurements for the assessment of combustion dynamics.14,24 Although lacking an established proportionality between line-of-sight integrated radiation measurements and q˙, the correlation of intensity with pressure can give a qualitative indication of the thermoacoustic interaction. Therefore, this article applies OH* and CH* radiation measurements as markers for heat release rate in rocket combustion at pressures well above the validated range. An assessment of the potential to use OH* and CH* emission as marker is performed by comparing the radiation measurements with the thermoacoustic state of the combustor.
A more straightforward approach to assessing the Rayleigh criterion is the direct extraction of q˙ from simulations, which again emphasises the need for high-quality validation data. In addition to global parameters such as combustion chamber pressure and mass flow rates of oxidiser (m˙o) and fuel (m˙f), detailed information concerning flow parameters and boundary conditions are necessary to validate that the injection, atomisation, and combustion processes are captured correctly. Hence there is a need for suitable experimental data.10,27 Here sub-scale combustion chambers play a special role since they can accommodate optical access and provide spatially resolved radiation measurements as a valuable point of comparison with numerical results.
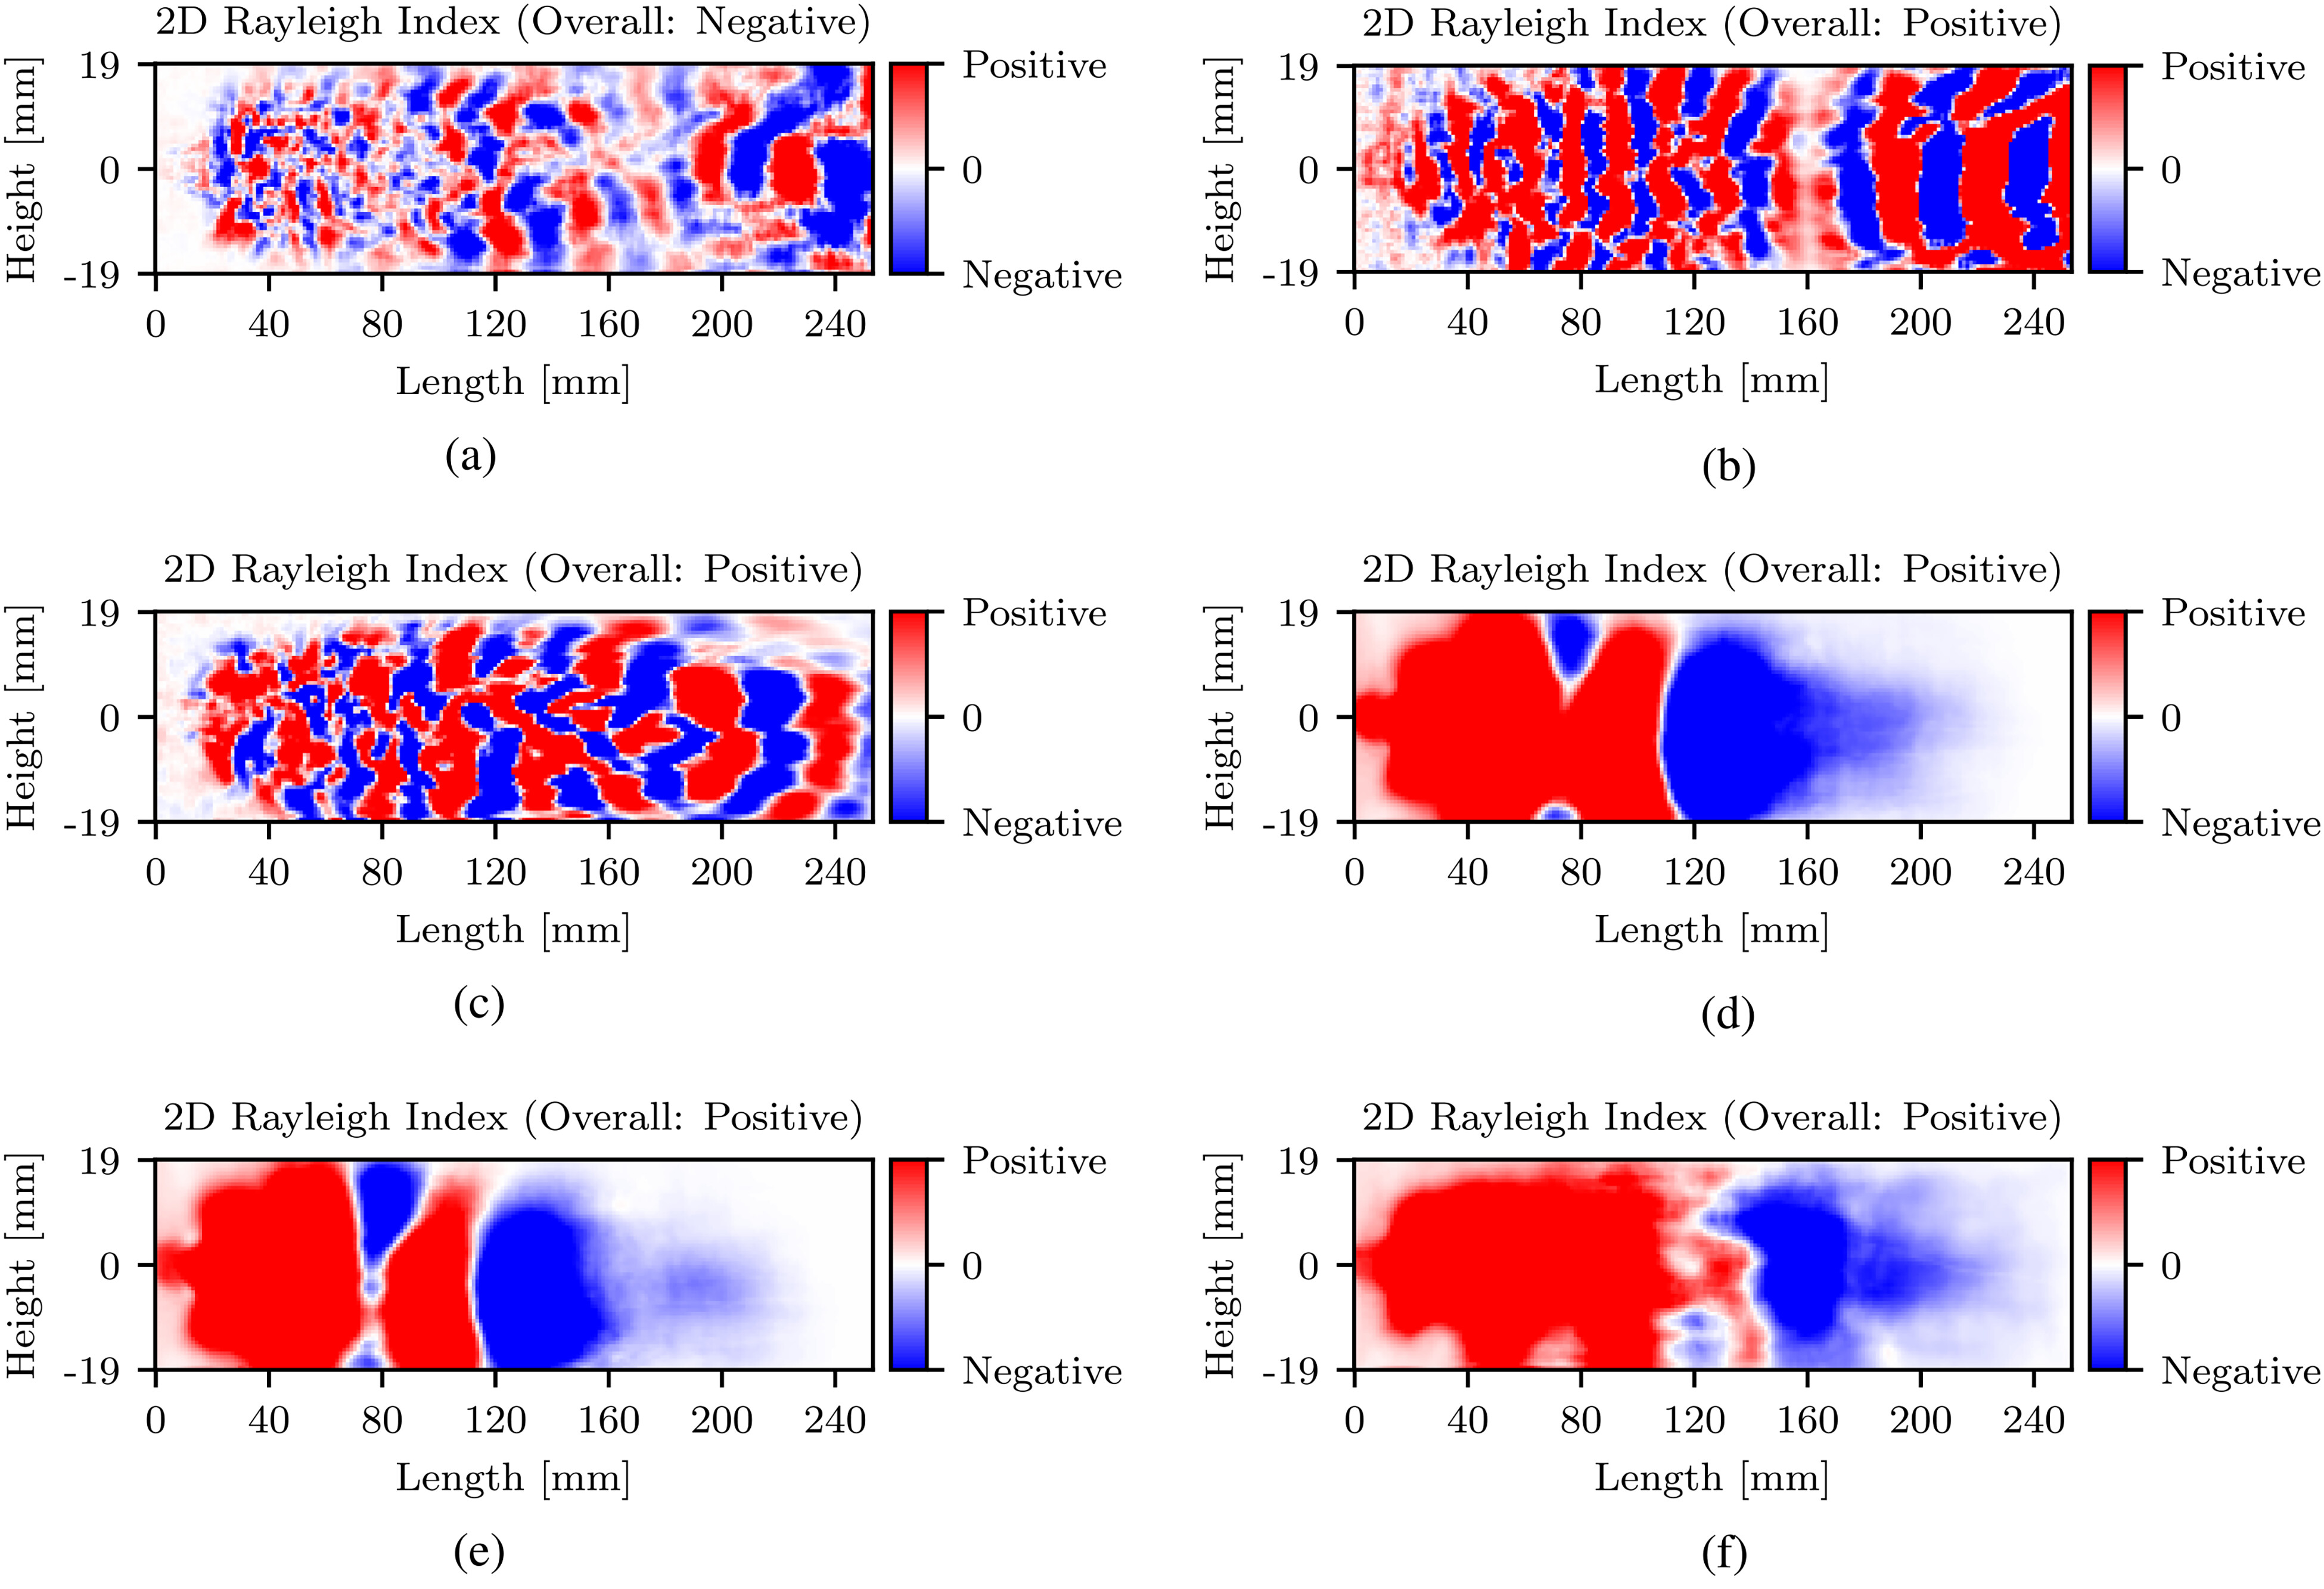
The DLR optically accessible rocket combustor model ‘N’ (BKN) addresses the aforementioned need for validation test cases and enables multiple opportunities for validation. The experiment is extensively equipped with conventional diagnostics, such as thermocouples and pressure sensors and is, therefore, able to provide well-defined boundary conditions, which can be compared to steady-state simulations or time-averaged results of unsteady simulations. The same applies to the large optical access window enabling the examination of a great portion of the flame and providing information on the steady-state flame topology. A time-resolved comparison between experiment and unsteady simulations can be performed by comparing the acoustic amplitudes or sequences of flame snapshots, as well as via qualitative comparison of thermoacoustic interaction facilitated by the 2D Rayleigh Index distributions under different sets of operating conditions presented later in this article.
This work presents experiments with BKN and the propellant combination of LOX and compressed-/liquefied-natural-gas (CNG/LNG) and a comparison with previous experiments with the same injection element but hydrogen (H2) as the fuel. In the tests with hydrocarbon fuel, high-speed imaging of OH* and CH* radiation was conducted. While there is no formation of CH* in LOX/H2 combustion, the same optical filter for CH* was used in the H2 tests to capture the blue radiation in the same wavelength range.
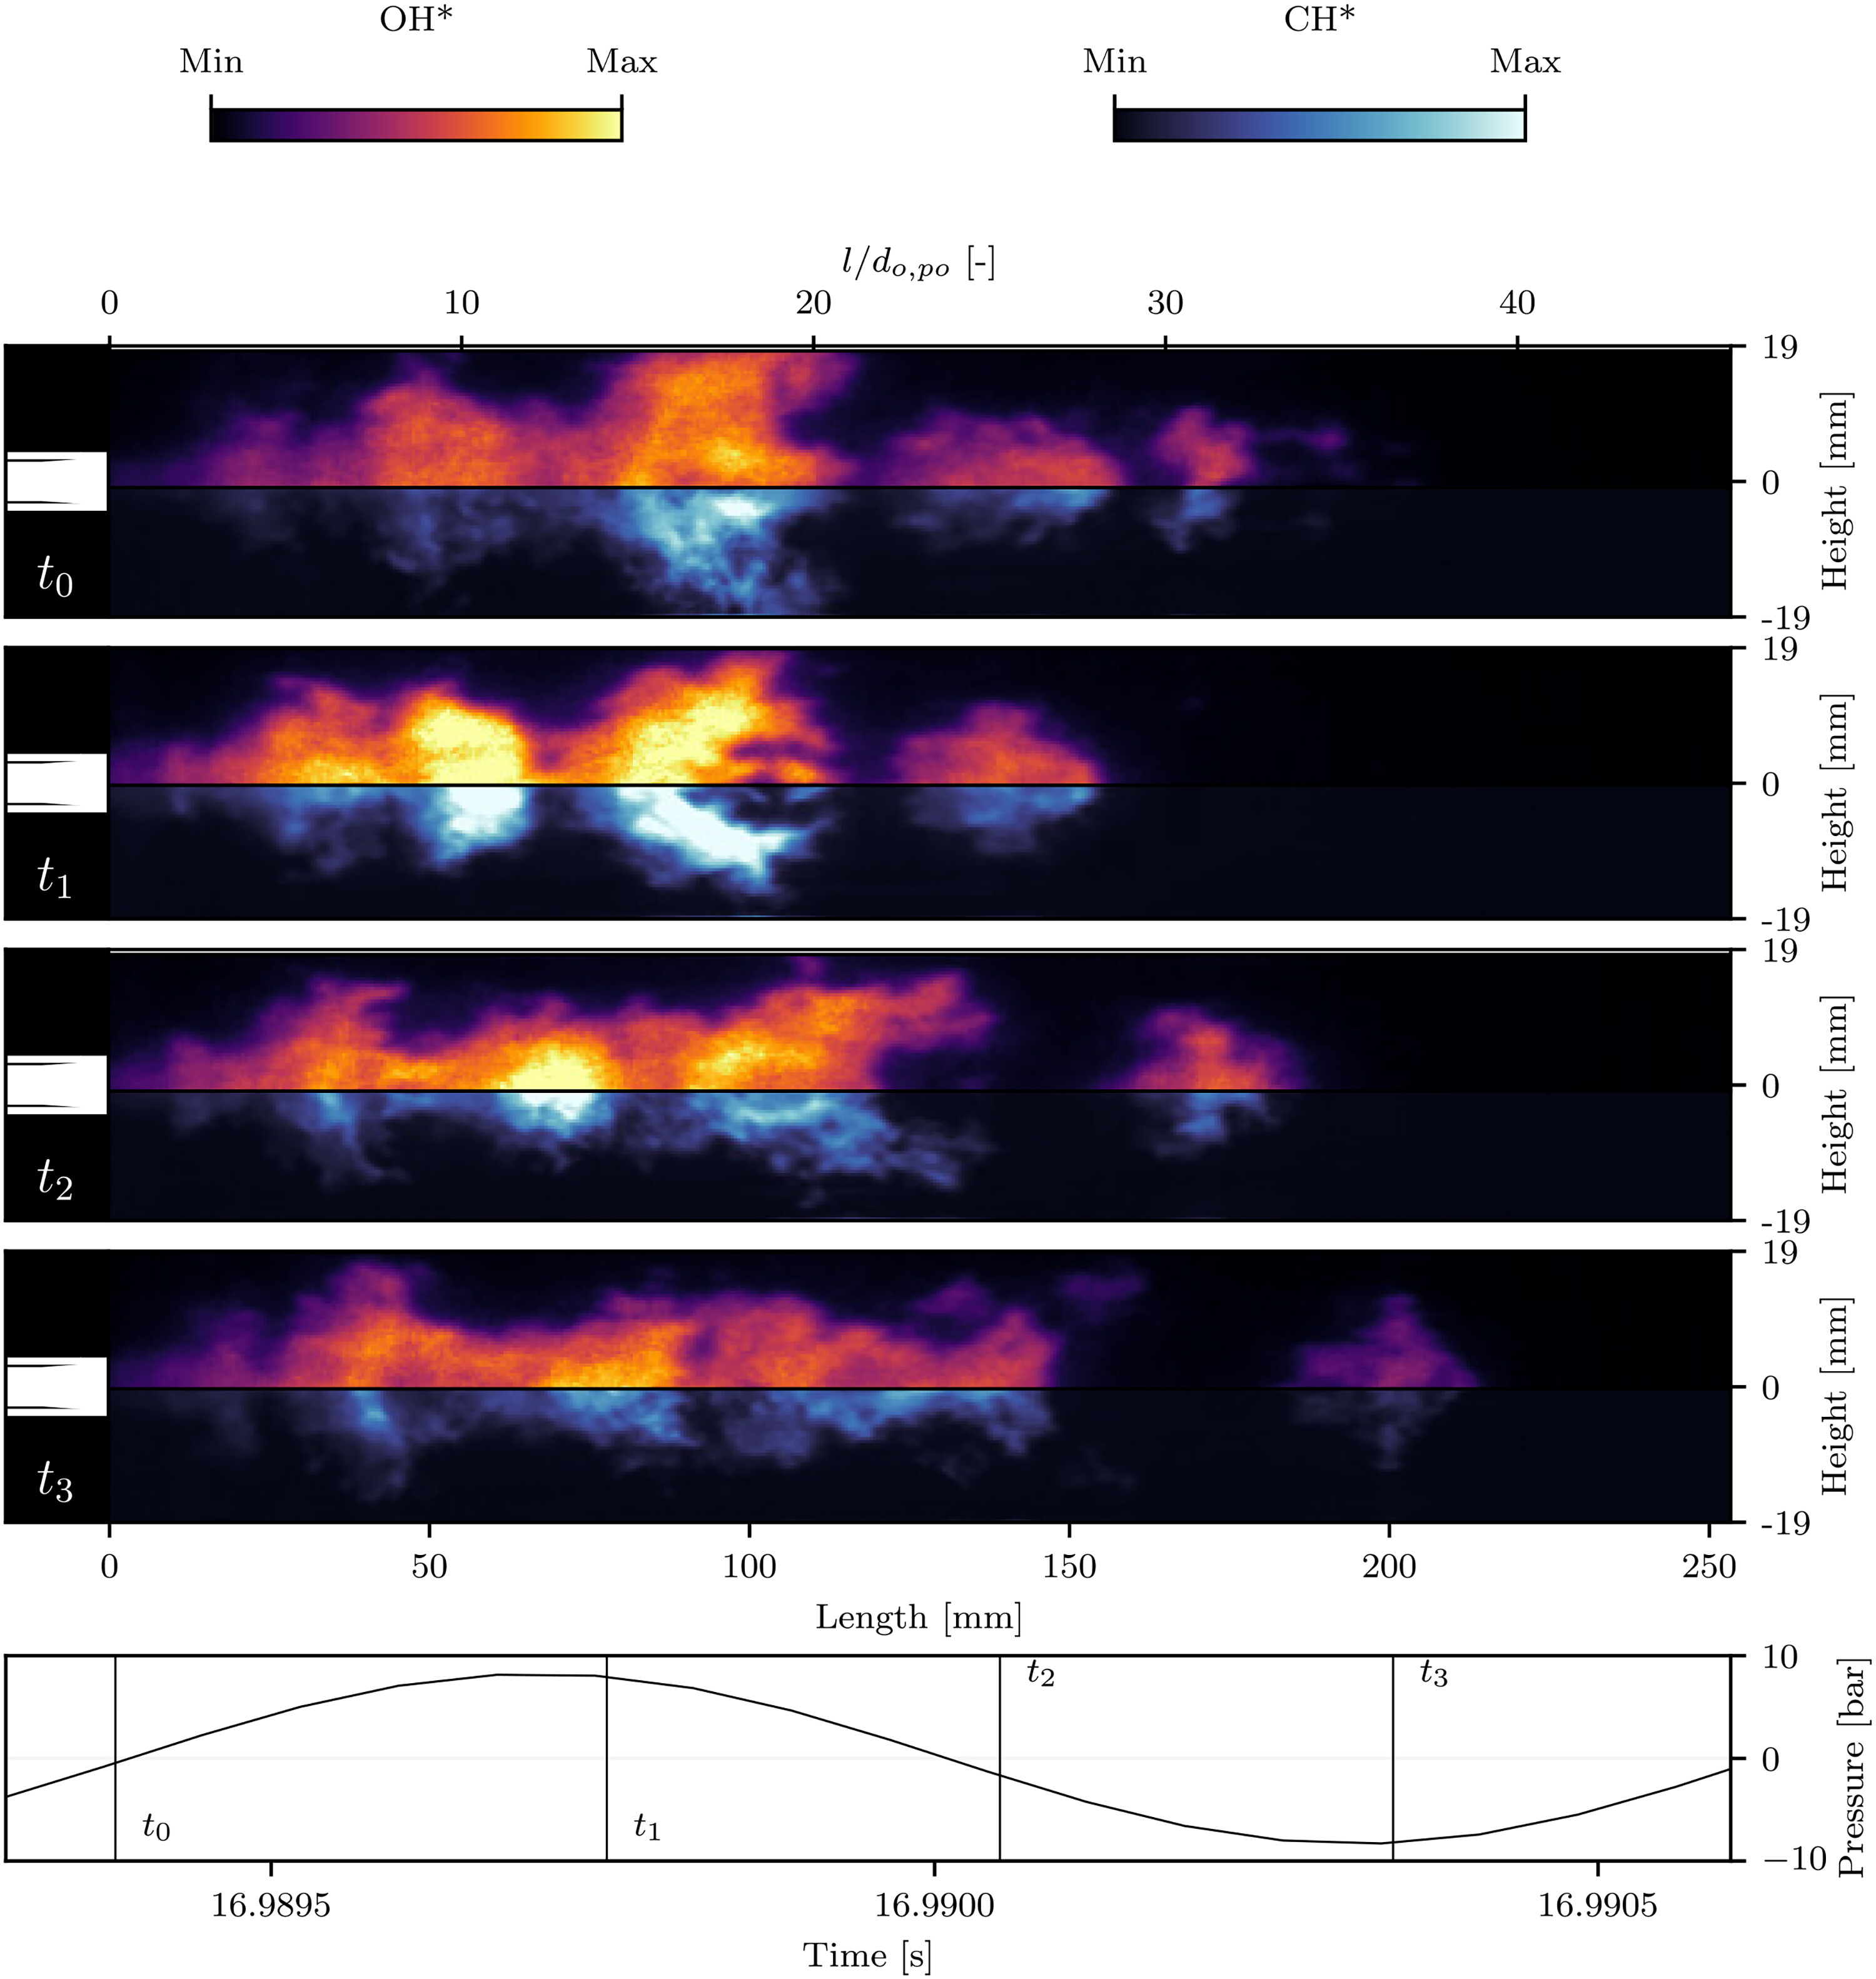
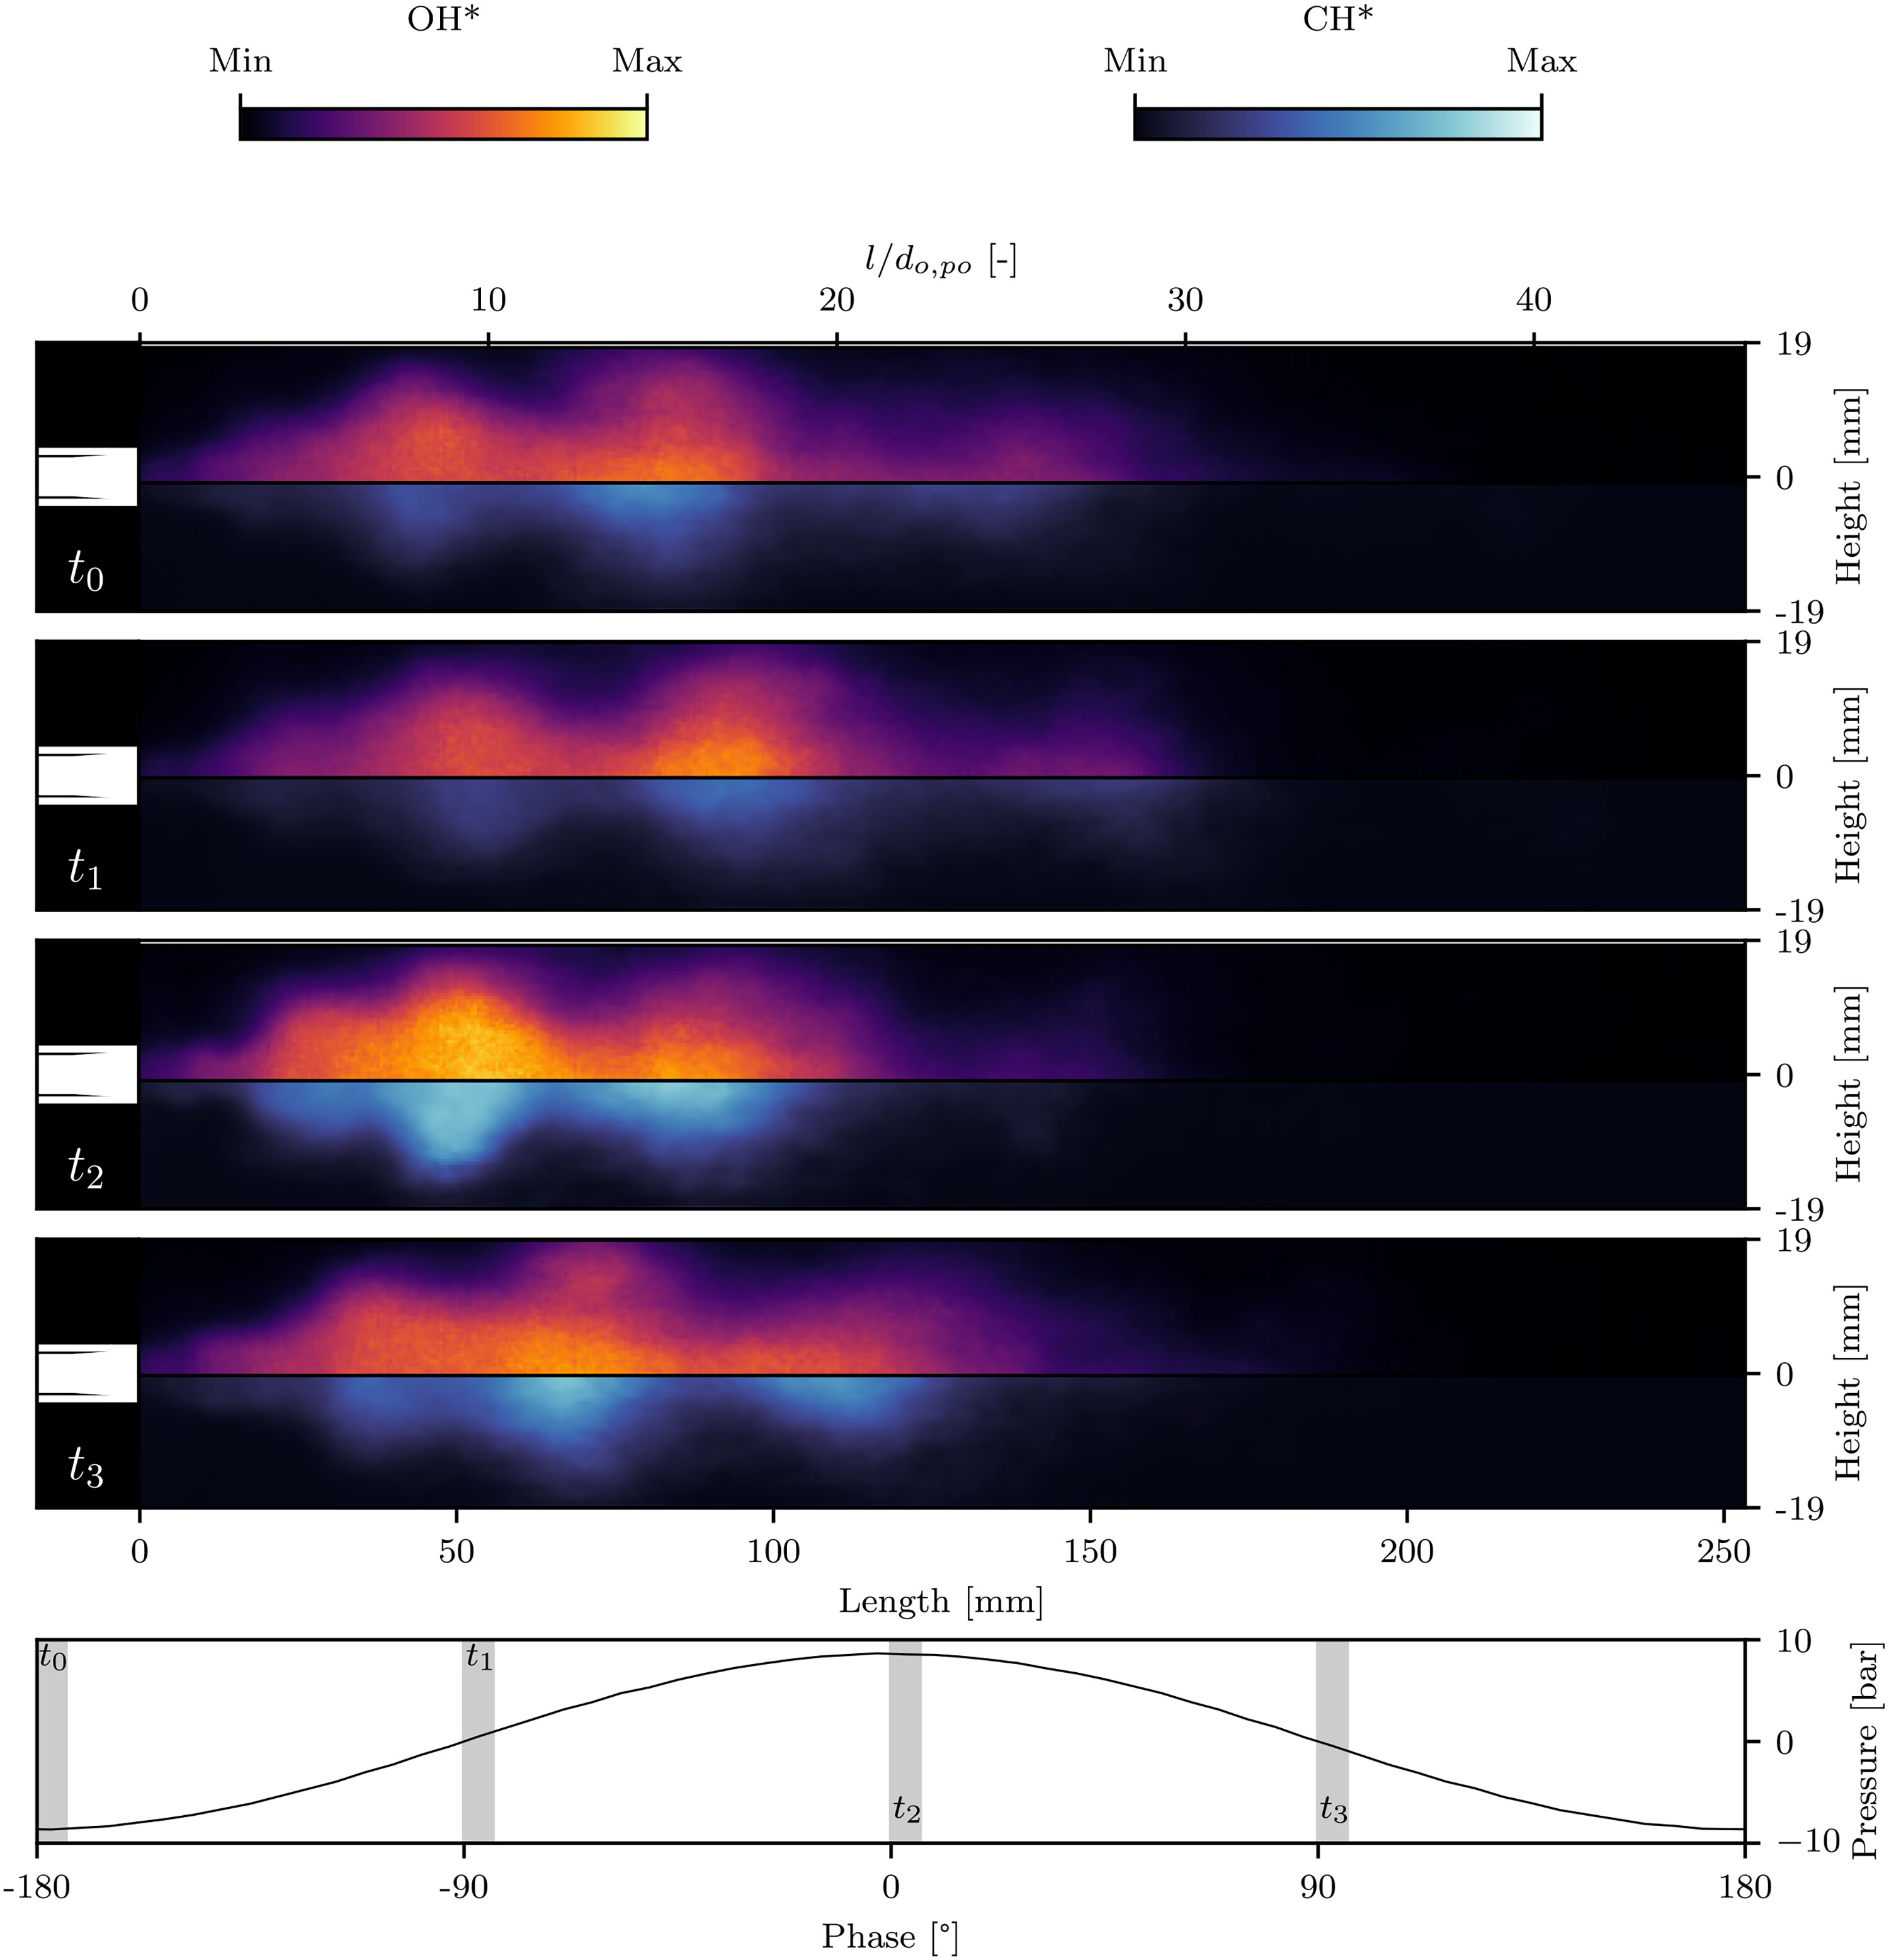
First, the experimental setup including the optical diagnostics and operating conditions will be presented for the latest experiments with LOX/CNG/LNG. Then, the methodology of the performed analysis will be described. The influence of four LOX/LNG operating conditions on the flame topology will be shown and discussed in comparison to previous LOX/CNG and LOX/H2 experiments. Finally, the flame response during intervals with high-amplitude, self-excited oscillation of the longitudinal acoustic resonance modes will be compared to intervals without significant excitation of the acoustic modes.

2. Experimental method

2.1. Combustion chamber

The hot-fire tests with BKN presented in this work were conducted at the European Research and Technology Test Facility P828 for cryogenic rocket engines. The experimental hardware consists of a single-element injector head, an optical combustion chamber segment with 50 mm diameter, additional chamber segments, and a convergent divergent nozzle with a throat diameter (dt) of 14.5 mm. This results in an overall length (lcc) from the injection plane to the nozzle throat of 539 mm for the subcritical and 609 mm for the supercritical operating conditions. The geometry of the inner surface of the optical access window matches the contour of the combustion chamber wall to minimise disturbance to the symmetry of the flow field in the combustion chamber.14 The schematic of the combustor configuration is illustrated in Figure 1.
Figure 1. Experimental combustor model ‘N’ (BKN) configuration.
In order to provide an extensive set of boundary conditions, at least one temperature, static pressure and unsteady pressure measurement is made in the manifolds for LOX (To,Po,po), LNG (Tf,Pf,pf) and window cooling (Tc,Pc,pc). The corresponding uncertainties for these types of measurements are given in Table 2. 13 type K thermocouples (Tcc,113) in the combustion chamber protrude approximately 0.1 mm into the chamber and are distributed every 20 mm between 4.5 and 244.5 mm downstream of the injection plane enabling measurement of the hot gas temperature in the boundary layer. An additional 12 type K thermocouples (Tccs,112) are mounted within the chamber walls with contact to the structure, 1 mm back from the combustion chamber wall and also placed every 20 mm between 34.5 and 254.5 mm downstream of the faceplate. The uncertainty of a temperature measurement with a type K thermocouple depends on the temperature and results in ±3.5 K for the temperature measurements in the chamber wall and ±6.5 K for the measurements protruding into the hot gas. Static pressure sensors (Pcc,113) sampled at a rate of 100 Hz are connected to the chamber at the same axial positions as Tcc,113. Depending on the sensor model, the uncertainty ranges from ±0.9 % to ±1.3 % of the absolute measured value. For acoustic measurements, six flush mounted, unsteady pressure sensors (Kistler 6043A120; pcc,16) are positioned at the distances of 34.5, 84.5, 94.5, 134.5, 164.5 and 234.5 mm downstream of the faceplate, and one recessed sensor is at 367 mm. The signals are sampled at a rate of 100 kHz with a measurement range of ±30 bar and a measurement uncertainty below 0.1 bar.
LOX and LNG are injected through a shear coaxial injection element with a tapered LOX post. A cooling film of CNG reducing the heat load to the windows is injected via an annular gap between the chamber wall and faceplate. Both injection systems are illustrated in Figure 2. The dimensions of the injection system are given in Table 1. Combustion was initialised via a torch igniter.
Figure 2. Injection system configuration.14
Table 1. Geometrical dimensions of injection systems.
Symboldo,orlo,ordo,polo,po
Unitmmmmmmmm
Value2.24.05.5127.0
     
Symboldo,exαlf,andf,ex
Unitmmmmmm
Value6.3834.58.2
     
Symbolhf,gapdc,exhc,gaplre
Unitmmmmmmmm
Value0.550.00.44.0

2.2. Optical setup

Visualization of the flame within the ultraviolet (UV) and blue wavelength regimes (BR) was carried out using two synchronously and coaxially recording high-speed camera systems. The UV regime is dominated by the intense radiation from the OH* radical with its intense emission bands around 310 nm. The excited H2O2 molecule with its broad spectral continuum around 450 nm29 is believed to strongly contribute to the BR. For hydrocarbon combustion, the methylidyne radical (CH*) radiating at 436 nm30 plays the dominant role. The optical axis was split by a dichroic mirror (transparent for visible light and reflective for UV radiation) in order to obtain an identical field of view for both camera systems.
The blue flame emission was recorded by a Photron® Fastcam SA-Z type 2100K-M-64G camera model. Its proprietary design advanced CMOS image sensor has an active area of 20.48 × 20.48 mm, and 1024 × 1024 pixels, respectively. The RAM capacity of 64 GB allows the storage of 43,682 frames at full resolution. Flame emission, without background illumination, was recorded with 7200–20,000 fps and exposure times of 16–30 μs. A Carl Zeiss® Makro-Planar ZF.2 lens with f = 100 mm and an aperture of 3.5 was used, equipped with a bandpass filter (CWL: 436 nm; FWHM: 10 nm; T (436 nm): 50%) from Andover Corporation.
UV radiation (OH*) was recorded using an image intensified Photron® Fastcam SA-X2 type 480K-M4 high-speed camera, also equipped with an identical proprietary design advanced CMOS image sensor. Frame rates of 7200–20,000 Hz were applied. The UV radiation was converted into visible light using a Hamamatsu® image intensifier, model C10880 GHD1101, which was attached to the camera’s lens mount. Gate width and gain were set for optimal image quality. A Nikon® UV-Nikkor f = 105 mm lens with an aperture of 4.5 was used, equipped with a UV bandpass filter (CWL: 306.8 nm; FWHM: 10 nm; T(306.8 nm): 64%).

2.3. Operating conditions

In the most recent campaign tests with BKN and the propellant combination LOX/CNG/LNG were conducted at chamber pressures from 41 up to 66 bar and ratios of oxidiser to fuel (ROF=m˙om˙f) at the main injector between 2.5 and 3.5. Data of four load points (LPs) originating from two different test runs are presented in detail in this work.
The test runs are presented in Figure 3. The test sequences are described with traces of the static chamber pressure Pcc, LOX injection temperature To, mixed CNG and LNG injection temperature Tf, and ratio of oxidiser to fuel mass flow rate ROF (bottom). These traces of parameters describe the perfomed sequence of operating conditions, while the raw unsteady pressure signal (middle) and the spectrogram (top) describe the acoustic character. The duration of the LPs are about 0.5 s for LP1-3,LNG and 0.3 s for LP4,LNG. This allows a steady-state thermal equilibrium condition to be reached. The intervals used for extracting the data of LP1,LNG and LP2,LNG (16.5–17.0 and 19.0–19.5 s in the first test) and LP3,LNG and LP4,LNG (15.9–16.4 and 4.9–5.2 s in the second test) are highlighted in grey. High-speed imaging of OH* and CH* with 13.5 kfps for LP1,LNG and LP2,LNG and 20 kfps for LP3,LNG and LP4,LNG is available. While the chamber pressure is above the critical pressure with respect to oxygen and methane (supercritical) for LP1,LNG and LP2,LNG, this is not the case for LP3,LNG and LP4,LNG (subcritical).
Figure 3. Sequence of tests with operating conditions and grey highlighted interval used for extracting the data for all load points. (a) Test 1; (b) Test 2.
Both test runs develop high amplitude combustion instabilities characterised by excitation of the chamber longitudinal resonance modes. Table 2 summarises the steady-state test condition and the injection conditions for all four load points. The data are mean values from a sample period of 0.5/0.3 s. Since the data from these four operating conditions will later be compared to data from previous tests, these are depicted as LNG LPs. This indicates that LNG was used with CNG to regulate the fuel injection temperature, while in previous tests solely CNG or cold gaseous hydrogen were used.
Table 2. Steady state and injection conditions for all four load points from the LOX/CNG/LNG tests.
ParameterUnitLoad pointUncertainty
  1,LNG2,LNG3,LNG4,LNG 
Pccbar62.965.441.340.5±1.1%
ROF 3.53.03.42.5±5%
m˙okg/s0.3580.3550.2280.215±3%
m˙fkg/s0.1030.1170.0680.088±3%
m˙ckg/s0.3380.3550.2120.208±3%
ToK104106105109±3.5K
TfK217216192255±3.5K
TcK281283271270±2.0K
LOX: liquid oxygen; CNG: compressed-natural-gas; LNG: liquefied-natural-gas; ROF: ratio of oxidizer to fuel.

3. Methodology

3.1. Flame topology analysis

The flame opening angle, flame width and flame length were measured within the framework of the flame topology analysis. For the flame opening angle, a threshold-based flame boundary detection algorithm14 was applied to a time-averaged image of the corresponding LP. A linear fit to the boundaries of the detected flame was performed in the first 6% of the flame’s optically accessible length, which enabled the derivation of a flame opening angle. For the determination of the flame width, the mean values of each row and for the flame length mean values of each column were calculated. In this case, 75% of the peak intensity from the time-averaged OH* and blue radiation images was used to define the flame width at the three-quarter maximum (FlW34M) and the flame length at the three-quarter maximum (FlL34M). It should be noted that in the latter case only the downstream limitation of the intensity at the three-quarter maximum has been considered.

3.2. Flame dynamics analysis

The dynamic mode decomposition (DMD) was applied to isolate the underlying dynamics in the data with respect to its frequencies. The slightly adapted implementation of a multi-variable DMD22 enables a direct analysis of the high-speed imaging in relation to measurements from various sensors. Therefore, the sensor data is resampled to the snapshots of high-speed imaging and added as pseudo-pixels to the input matrix of the DMD algorithm. The algorithm decomposes the data into three matrices. One containing the spatial data, the second containing the amplitudes and the third the temporal data of each mode. The matrix containing the spatial data of each mode is divided again into the imaging and sensor data. Thus each type of measurement can be treated individually, but is filtered to modes containing the same frequency content.
The decomposed pressure oscillations gained from the DMD can be compared to bandpass filtered data with a narrow filter width and are used to reconstruct the pressure field in the chamber. The axial pressure distribution and thus the pressure field in the window region is interpolated by a spline-interpolation method. Combining both (intensity and pressure) reconstructions, a 2D Rayleigh Index via equation (2) for each (or multiple) frequencies referring to the decomposed mode(s) m can be calculated.
RI(x,r)=m(|p(x,r,f(m))I(x,r,f(m))|cos(ΘpI(x,r,f(m))))
(2)
Here I denotes the fluctuating part of the captured intensity, p the pressure oscillations and ΘpI the phase difference (according to equation (3)) between those signals for each pixel in dependency of the reconstructed mode and thus the frequency.
ΘpI(x,r,f(m)))=Θp(x,r,f(m))ΘI(x,r,f(m))
(3)
It should be noted here that the optical data is gained from three different test campaigns. Although the camera settings were kept constant for the different load points within a test campaign, these are changed between the different test campaigns. In order to enable quantitative comparability, the intensity fluctuation measurements were normalised by the mean intensity within the corresponding interval.

4. Results

4.1. Flame characteristics

First, the flame visualisations will be shown for the four LPs with the propellant combination of LOX/LNG. The instantaneous flame radiation measurements of the first recorded frame in each LP (Figure 4(a) to (d)) show the OH* imaging on the top and the CH* imaging at the bottom. The CH* radiation displays the same half of the flame as the OH* radiation but mirrored.
Figure 4. Instantaneous flame radiation imaging (OH*/CH*) (a) LP1,LNG; (b) LP2,LNG; (c) LP3,LNG; (d) LP4,LNG. LP: load point; LNG: liquefied-natural-gas.
Figure 5. Sequence of instantaneous flame radiation snapshot (OH*/CH*) with respect to bandpass-filtered (at 1L frequency) unsteady pressure pcc,1 for LP1,LNG. LP: load point; LNG: liquefied-natural-gas.
Figure 6. Time-averaged flame radiation imaging (OH*/CH*) (a) LP1,LNG; (b) LP2,LNG; (c) LP3,LNG; (d) LP4,LNG. LP: load point; LNG: liquefied-natural-gas.
The first three LNG LPs are dominated by high-amplitude longitudinal combustion instabilities. This is reflected in the flame radiation imaging, with the high-speed image sequences describing a violent longitudinal pulsation of the flame, undergoing stretching and compression due to entrainment in the acoustic velocity field. The instantaneous snapshots show a significantly shorter flame compared to stable conditions in LP4,LNG. Moreover, the flames are interrupted through their pulsating motion, being pinched and separated into large pockets of combusting propellants from around 60 to 90 mm downstream. Figure 5 visualises this pulsating motion via a sequence of instantaneous snapshots within one acoustic pressure cycle for LP1,LNG. The snapshot at t0 is taken during the phase of highest acoustic velocity towards the head end of the chamber. Here it can be seen that 120 mm downstream of the injection plane the flame is separated. The snapshot at t1 is taken during the phase of highest pressure in the head end of the chamber and features the shortest flame. A second constriction of the flame 70 mm downstream of the faceplate is noticeable. Throughout the phase of the highest acoustic velocity towards the nozzle (t2) the flame starts to grow again and with the acoustic pressure near the faceplate reaching its minimum (t3) the flame is longest.
The time-averaged flame images of the three unstable LPs (Figure 6(a) to (c)) also show the shorter flame in comparison to LP4,LNG (Figure 6(d)). The average images for LP3,LNG and LP4,LNG (Figure 6(c)/(d)) suffer from regions of reduced intensity within the flame around 90–140 mm downstream due to soot deposition onto the surface of the quartz window. The soot contamination affects the CH* radiation intensity more than OH*. The soot contamination is also visible for LP3,LNG and LP4,LNG in Figure 7 illustrating the standard deviation of each pixel. However, differences in the fluctuating radiation intensity between the unstable LP3,LNG and LP4,LNG are still detectable. The OH* radiation measurements for LP3,LNG feature a broad and highly fluctuating intensity within the flame region. LP4,LNG is characterised by weaker OH* fluctuations limited to the shear layer throughout the flame. The comparison between the UV and BR measurements generally emphasises the high self-absorption of OH* radiation. While the OH* measurements mainly fluctuate in the shear layer of the flame high-intensity CH* fluctuations are also taking place towards the centre of the flame. This, again, shows that radiation measurements covering the blue wavelengths are better suited as a marker estimating the line-of-sight integrated heat release rate.
Figure 7. Standard deviation images of flame radiation (OH*/CH*) (a) LP1,LNG; (b) LP2,LNG; (c) LP3,LNG; (d) LP4,LNG. LP: load point; LNG: liquefied-natural-gas.
Figure 8 visualises a sequence of phase-averaged images over LP1,LNG within one acoustic pressure cycle. Generally, the phase-averaged images provide the same information as the previously shown sequence of snapshots. But it can be also seen that the process and location of separation into large pockets of combusting propellants varies slightly within each cycle. In contrast to the sequence of instantaneous snapshots, a low level of averaged intensity can be noticed at locations where in Figure 5, a clear break in the flame is seen.
Figure 8. Sequence of phase-averaged flame radiation imaging (OH*/CH*) with respect to bandpass-filtered (at 1L frequency) and phase-averaged unsteady pressure pcc,1 for LP1,LNG. LP: load point; LNG: liquefied-natural-gas.
The hot gas temperature and the structural temperature measurements also reflect the shorter flame due to the combustion instabilities in LP1,LNG–LP3,LNG revealed by the flame imaging. The hot gas temperatures (Figure 9(a)), approximating the adiabatic wall temperature, show a moderate rise of the temperature between the injection plane and the thermocouples at the end of the optical segment for LP4,LNG. In LP1,LNG–LP3,LNG, a steep rise of the measured values is noticeable for the hot gas temperatures in the first 100 mm of the chamber, followed by a decrease from approximately 150 mm. Additionally, the unstable LP1,LNG, LP2,LNG and LP3,LNG feature a higher peak temperature of the axial temperature profile. Due to the high-amplitude instabilities accompanied by high temperatures within the chamber the thermocouples at 84.5, 104.5 and 144.5 mm were damaged during a previous test and thus no measurements are available for LP1,LNG and LP2,LNG.
Figure 9. Axial development of conventional measurements for LP1,LNG-LP4,LNG. (a) Hot gas temperature; (b) Wall temperature; (c) Pressure. LP: load point; LNG: liquefied-natural-gas.
The structural temperatures also reach their peak by around 100 mm, as shown in Figure 9(b). However, there is no monotonic decrease after 150 mm as in the gas temperature distribution. The thermocouple at 170 mm was damaged and can be neglected in this plot.
The pressure measurements in Figure 9(c) show only a slight decrease towards the end of the optical segment. This is to be expected due to the long chamber length and high contraction ratio (ϵc) of the nozzle.
In the next section further flame characteristics, flame opening angle, width and length of the presented LPs with the propellants of LOX/LNG will be compared to LPs in previous test campaigns with the same combustion chamber and injection element, but with LOX/H2 and LOX/CNG. A precise description of these LPs can be found in previous publications focusing on the tests with LOX/H214 and LOX/CNG.32 A short description including chamber pressure and ROF can be found in Table 3. All parameters have been derived from the time-averaged flame imaging of each LP.
Table 3. Acoustic amplitudes and integrated Rayleigh Index with respect to each LP.
Load point1,H22,H23,H21,CNG1,CNG1,LNG2,LNG3,LNG4,LNG
Pcc [bar]64.367.643.066.866.862.965.441.340.5
ROF [-]4.05.83.42.82.83.53.03.42.5
1L frequency [Hz]24252425247013101340815806920830
Instabilityχχχχ✓/χχ
p^cc,1Pcc [%]0.070.10.040.10.412.711.310.40.2
RIBR(060mm,hwindow)8.7×1032.7×1025.8×1049.7×1026.4×1014.6×1033.4×1032.1×1032.2×101
RIOH(060mm,hwindow)4.1×1021.5×1012.5×1026.1×1026.9×1013.1×1032.3×1031.5×1032.7×101
Uncertainty (RI,,1L)±25±25±25±16±16±15±15±17±15
LP: load point; LNG: liquefied-natural-gas; CNG: compressed-natural-gas; ROF: ratios of oxidizer to fuel.
The flame opening angles for the stable H2 and LNG LPs in the blue wavelength regimes, plotted in Figure 10(a), follow the expected trend. Higher opening angles are measured for higher values of VR and J, due to the increased shear forces and thus improved mixing.33,14 The values from the more unstable LPs in the CNG and LNG campaigns do not behave similarly, which can be explained by the excited longitudinal resonance modes of the chamber causing the opening angle to vary dynamically and be generally increased by the upstream compression of the flame by the acoustic oscillations. The dynamic pulsation in the near injector region is also responsible for the large uncertainty in these measurements. The same applies to the outlying OH* measurements in the tests with CNG. The increased angles and heightened uncertainty also reflect fluctuations in the near injector region as discussed in a previous publication.34 It can also be seen that for the LNG campaign, the spread between the extracted angle based upon the CH* and OH* radiation is increased.
Figure 10. Flame characteristics in correlation to momentum flux ratio for LP1,H2, LP2,H2, LP1,CNG (Table 3) and LP1,LNG-LP4,LNG (Table 2). (a) Flame opening angle; (b) flame width; (c) flame length. LP: load point; LNG: liquefied-natural-gas; CNG: compressed-natural-gas.
The flame width values plotted in Figure 10(b) are relatively constant for the stable operating conditions with H2 and operating conditions with intermittent excitation of the longitudinal resonance modes observed with CNG as fuel. Perhaps the tests with natural gas as fuel tend to feature higher values. Again, the unstable LPs of the LNG campaign result in considerably higher values for the flame width. The outlying flame width value of approximately 20 mm based upon the CH* measurement with LNG as fuel is compromised by the contamination of the quartz glass as discussed with respect to Figure 6(c).
Flame length measurements are plotted in Figure 10(c). While for the LOX/H2 experiments, the flame length ranged from 190 to 240 mm, no decrease of the intensity was detectable for the CNG tests and the LNG LP4 with stable conditions and thus a flame longer than the optical accessible length of the window (253.5 mm) was assumed. The unstable LPs with LNG feature a flame with nearly half of the length compared to previous tests due to the previously discussed flame dynamics.

4.2. Flame response

The flame response in the form of calculated 2D Rayleigh Indices according to equation (2) will now be presented. Recalling that the standard deviation (Figure 7) images revealed a fluctuating intensity throughout the whole flame region for CH* and given that the BR (including CH* for CNG/LNG fuel) has a greater depth of view,35 more and detailed information about the integral rate of heat release is contained in this measurement. Therefore, only the calculated 2D Rayleigh Indices based on the BR measurements were used for illustration purposes. Within the index distributions, positive (red) values means that the acoustic and intensity oscillations are in phase, while negative (blue) regions show counter-phased dynamics.
First visualisations of the 2D Rayleigh Index for the reconstructed data of the DMD modes containing the chamber 1L frequency will be shown. Figure 11(a) visualises the flame response for stable LOX/H2 operating conditions (LP2,H2). Here, alternating small red and blue structures can be seen. These describe the downstream convection of small turbulent structures on the flame surface. The overall Rayleigh index, integrated over the whole window region, is marginally negative. Thus, no major interaction between the acoustic field and the flame is taking place.
Figure 11. Two-dimensional Rayleigh Index distribution at the chamber 1L frequency. (a) LP2,H231; (b) excited interval of LP1,CNG32; (c) LP4,LNG; (d) LP1,LNG; (e) LP2,LNG; (f) LP3,LNG. LP: load point; LNG: liquefied-natural-gas; CNG: compressed-natural-gas.
This is not the case for the excited interval of the LOX/CNG load point (LP1,CNG) in Figure 11(b). Here, the overall index is positive. Furthermore, the regions in which the flame couples with the acoustic field form larger (red) structures. The near injector region is known to have a major influence on the stability behaviour of combustion chambers with shear coaxial injectors,36,37 and this region is dominated by positive coupling. A similar but weaker behaviour can be seen for the stable LP4,LNG (Figure 11(c)). Finally, the index distributions of the three unstable conditions (LP1,LNG-LP3,LNG) are shown in Figure 11(d) to (f), and draw a different picture. In addition to a strongly positive overall index, it can be clearly seen that nearly the whole flame zone is positively coupled with the acoustic pressure oscillations. This shows that the reaction rates for the combustion of LOX and natural gas under these operating conditions favour a positive feedback-loop between the pressure oscillations and the heat release fluctuations enabling the thermoacoustic amplitude to grow and to sustain the combustion instabilities.
Table 3 summarises the integrated Rayleigh Index in the first 60 mm of the chamber and compares these values to the acoustic amplitude of pcc,1 (located at 34.5 mm) normalised by the mean chamber pressure (Pcc) for the tests with LOX/H2,14,31 LOX/CNG32 and LOX/LNG. A window for the Rayleigh-Index covering the first 60 mm was chosen to ensure that up to the 3L mode no nodal line is contained within this cut-out. The calculated 2D Rayleigh Indices reflect the level of thermoacoustic excitation within the chamber consistently. Higher values of the overall Rayleigh index from the first 60 mm are associated with higher normalised acoustic pressure oscillations. The same applies for the OH* radiation intensity, as illustrated in Figure 12 and shows that in general the large-scale response and the overall Rayleigh Index, whether positive or negative, is similar between UV and BR measurements. Table 3 also contains the exemplary phase uncertainty for the 1L mode, which grows linearly with the frequency considered for obtaining the Rayleigh Index. The uncertainty is mostly driven by the recording rate of the high-speed cameras.
Figure 12. Acoustic amplitude in correlation to the calculated Rayleigh indices from Table 3.
Next, the integral Rayleigh Index (over the whole window area) is plotted in Figure 13 against frequency for the aforementioned H2, CNG, and four LNG LPs of Figure 11. The Rayleigh Index spectra are obtained by calculating the 2D Rayleigh Index for each DMD mode and thus the whole frequency spectra available. These also reflect the thermoacoustic state of the chamber consistently. The stable LPs with H2 (LP2,H2; Figure 13(a)) and LNG (LP4,LNG; Figure 13(c)) show nearly no response of the flame radiation near the eigenmodes of the chamber. Some positive values are found in the low-frequency range where broadband combustion noise is always present. During the excited interval of LP1,CNG Figure 13(b)) a minor positive flame response can be seen. This corresponds to the interval where intermittent excitation of the chamber 1L mode was observed. The LPs with high amplitude instabilities have a strong flame response to the chamber eigenmodes. The supercritical LP1,LNG (Figure 13(d)) and LP2,LNG (Figure 13(e)) have a positive response for the first two eigenmodes, yet curiously a negative response for the third mode and above. The subcritical LP3,LNG, on the other hand, has strong positive responses for all observable eigenmodes. It could be speculated that the flame response may differ for sub- and supercritical conditions due to the well-known differences in atomisation and mixing characteristics for the regimes. However, further investigation is required to seek a physical explanation for this observation.
Figure 13. Integral Rayleigh Index spectra. Note that the y-axis scale is linear below absolute values of 100 and logarithmic above. (a) LP2,H2.31; (b) Excited interval of LP1,CNG.32; (c) LP4,LNG; (d) LP1,LNG; (e) LP2,LNG; (f) LP3,LNG. LP: load point; LNG: liquefied-natural-gas; CNG: compressed-natural-gas.

5. Conclusion

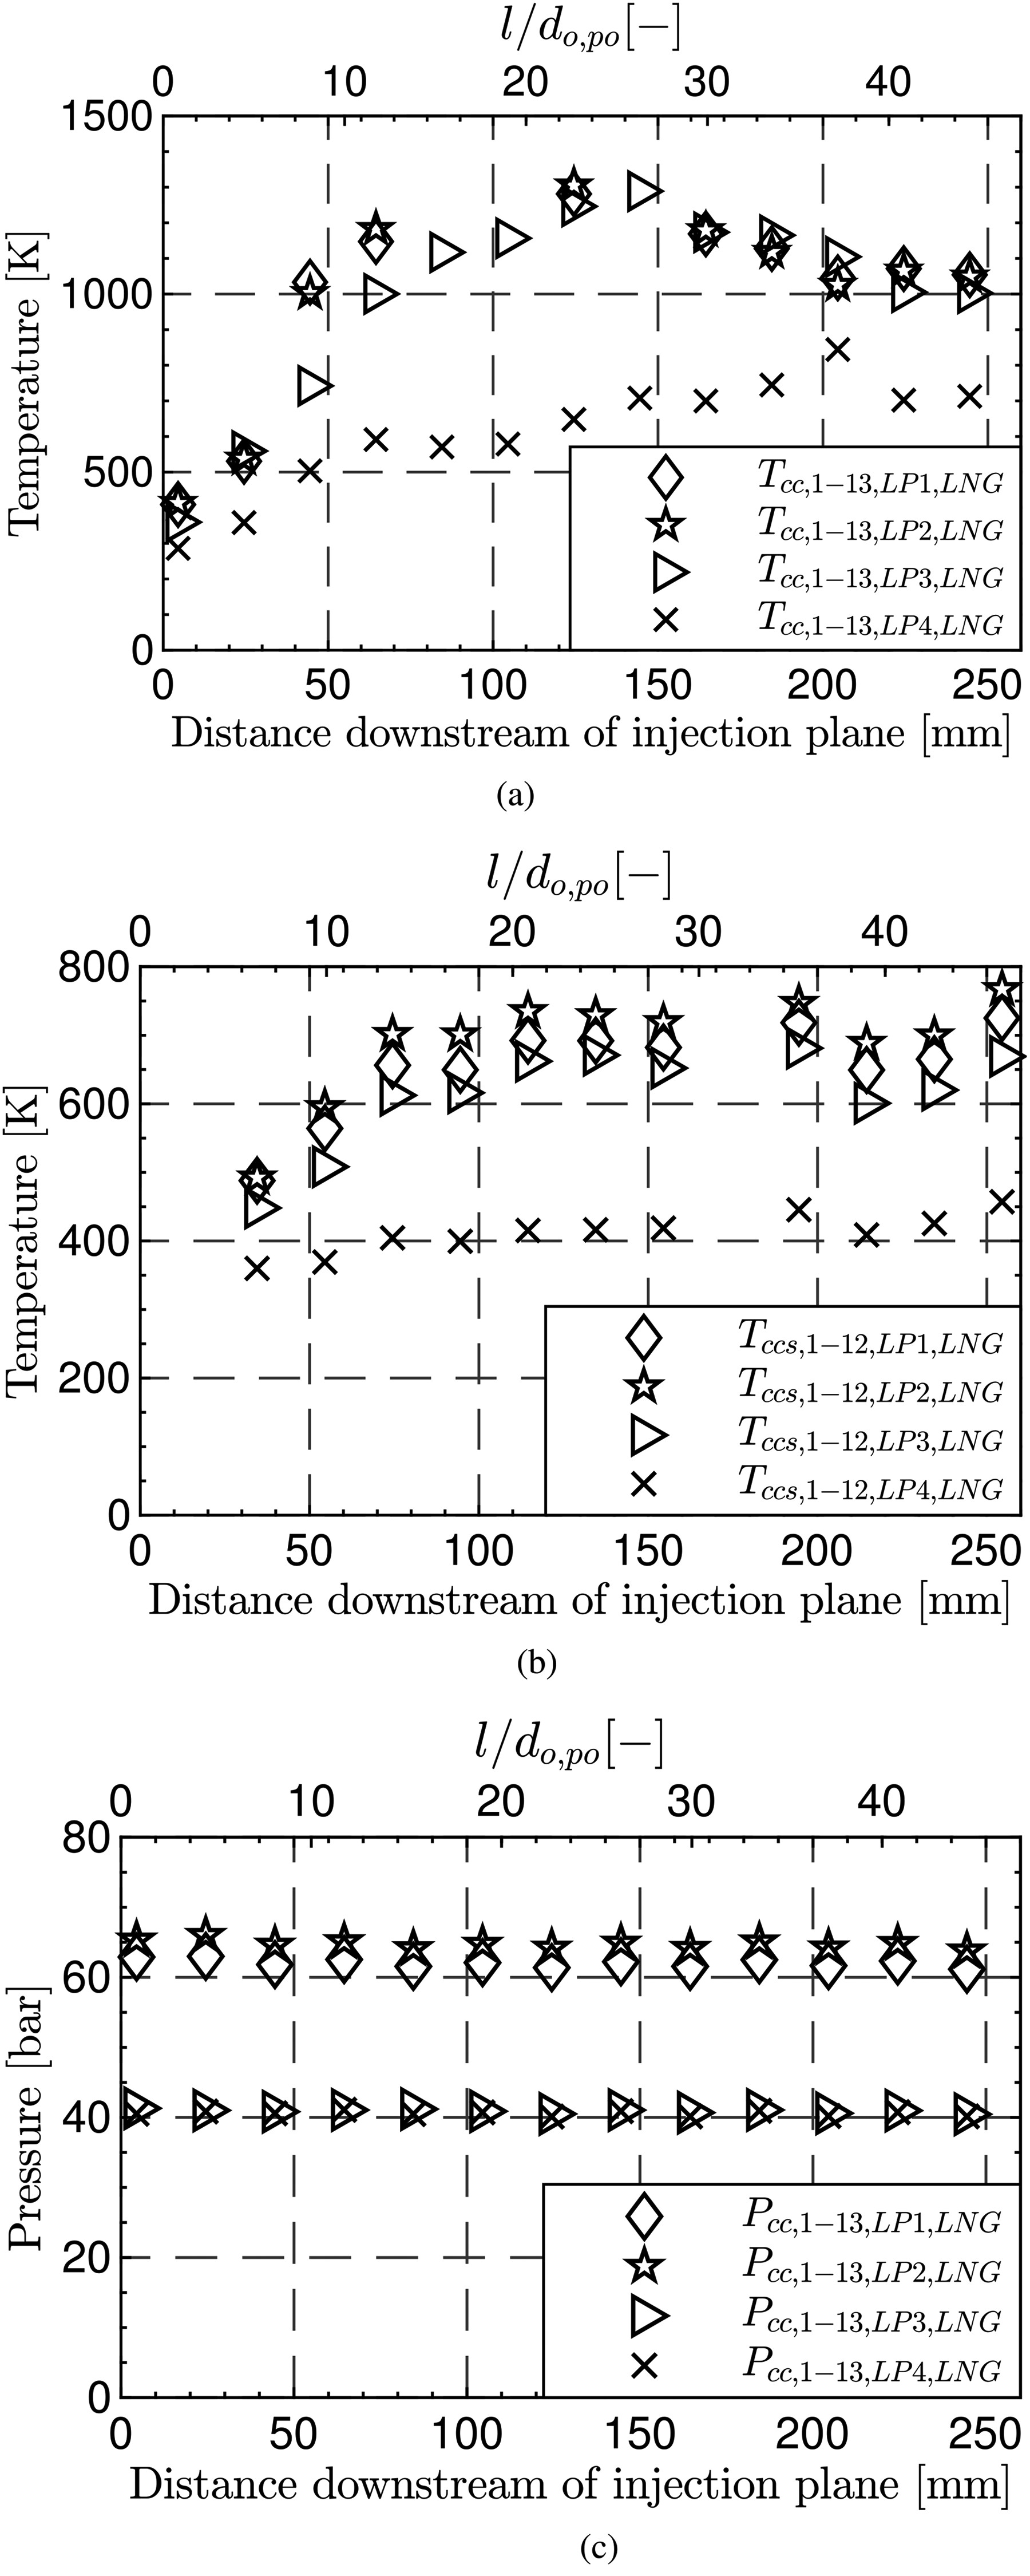
Four different operating conditions of thermoacoustically unstable and stable combustion in an experimental rocket combustor with large optical access using the propellant combination LOX/LNG were presented in detail in this work. The propellants were injected through a shear coaxial injection element. Simultaneous flame radiation imaging of the ultraviolet and blue wavelength ranges was conducted. In combination with the axial development of temperature and pressure signals, well-defined information on the boundary conditions in the combustion chamber is provided and allows the usage of this dataset as a test case for validating numerical modelling of LOX/methane flames.
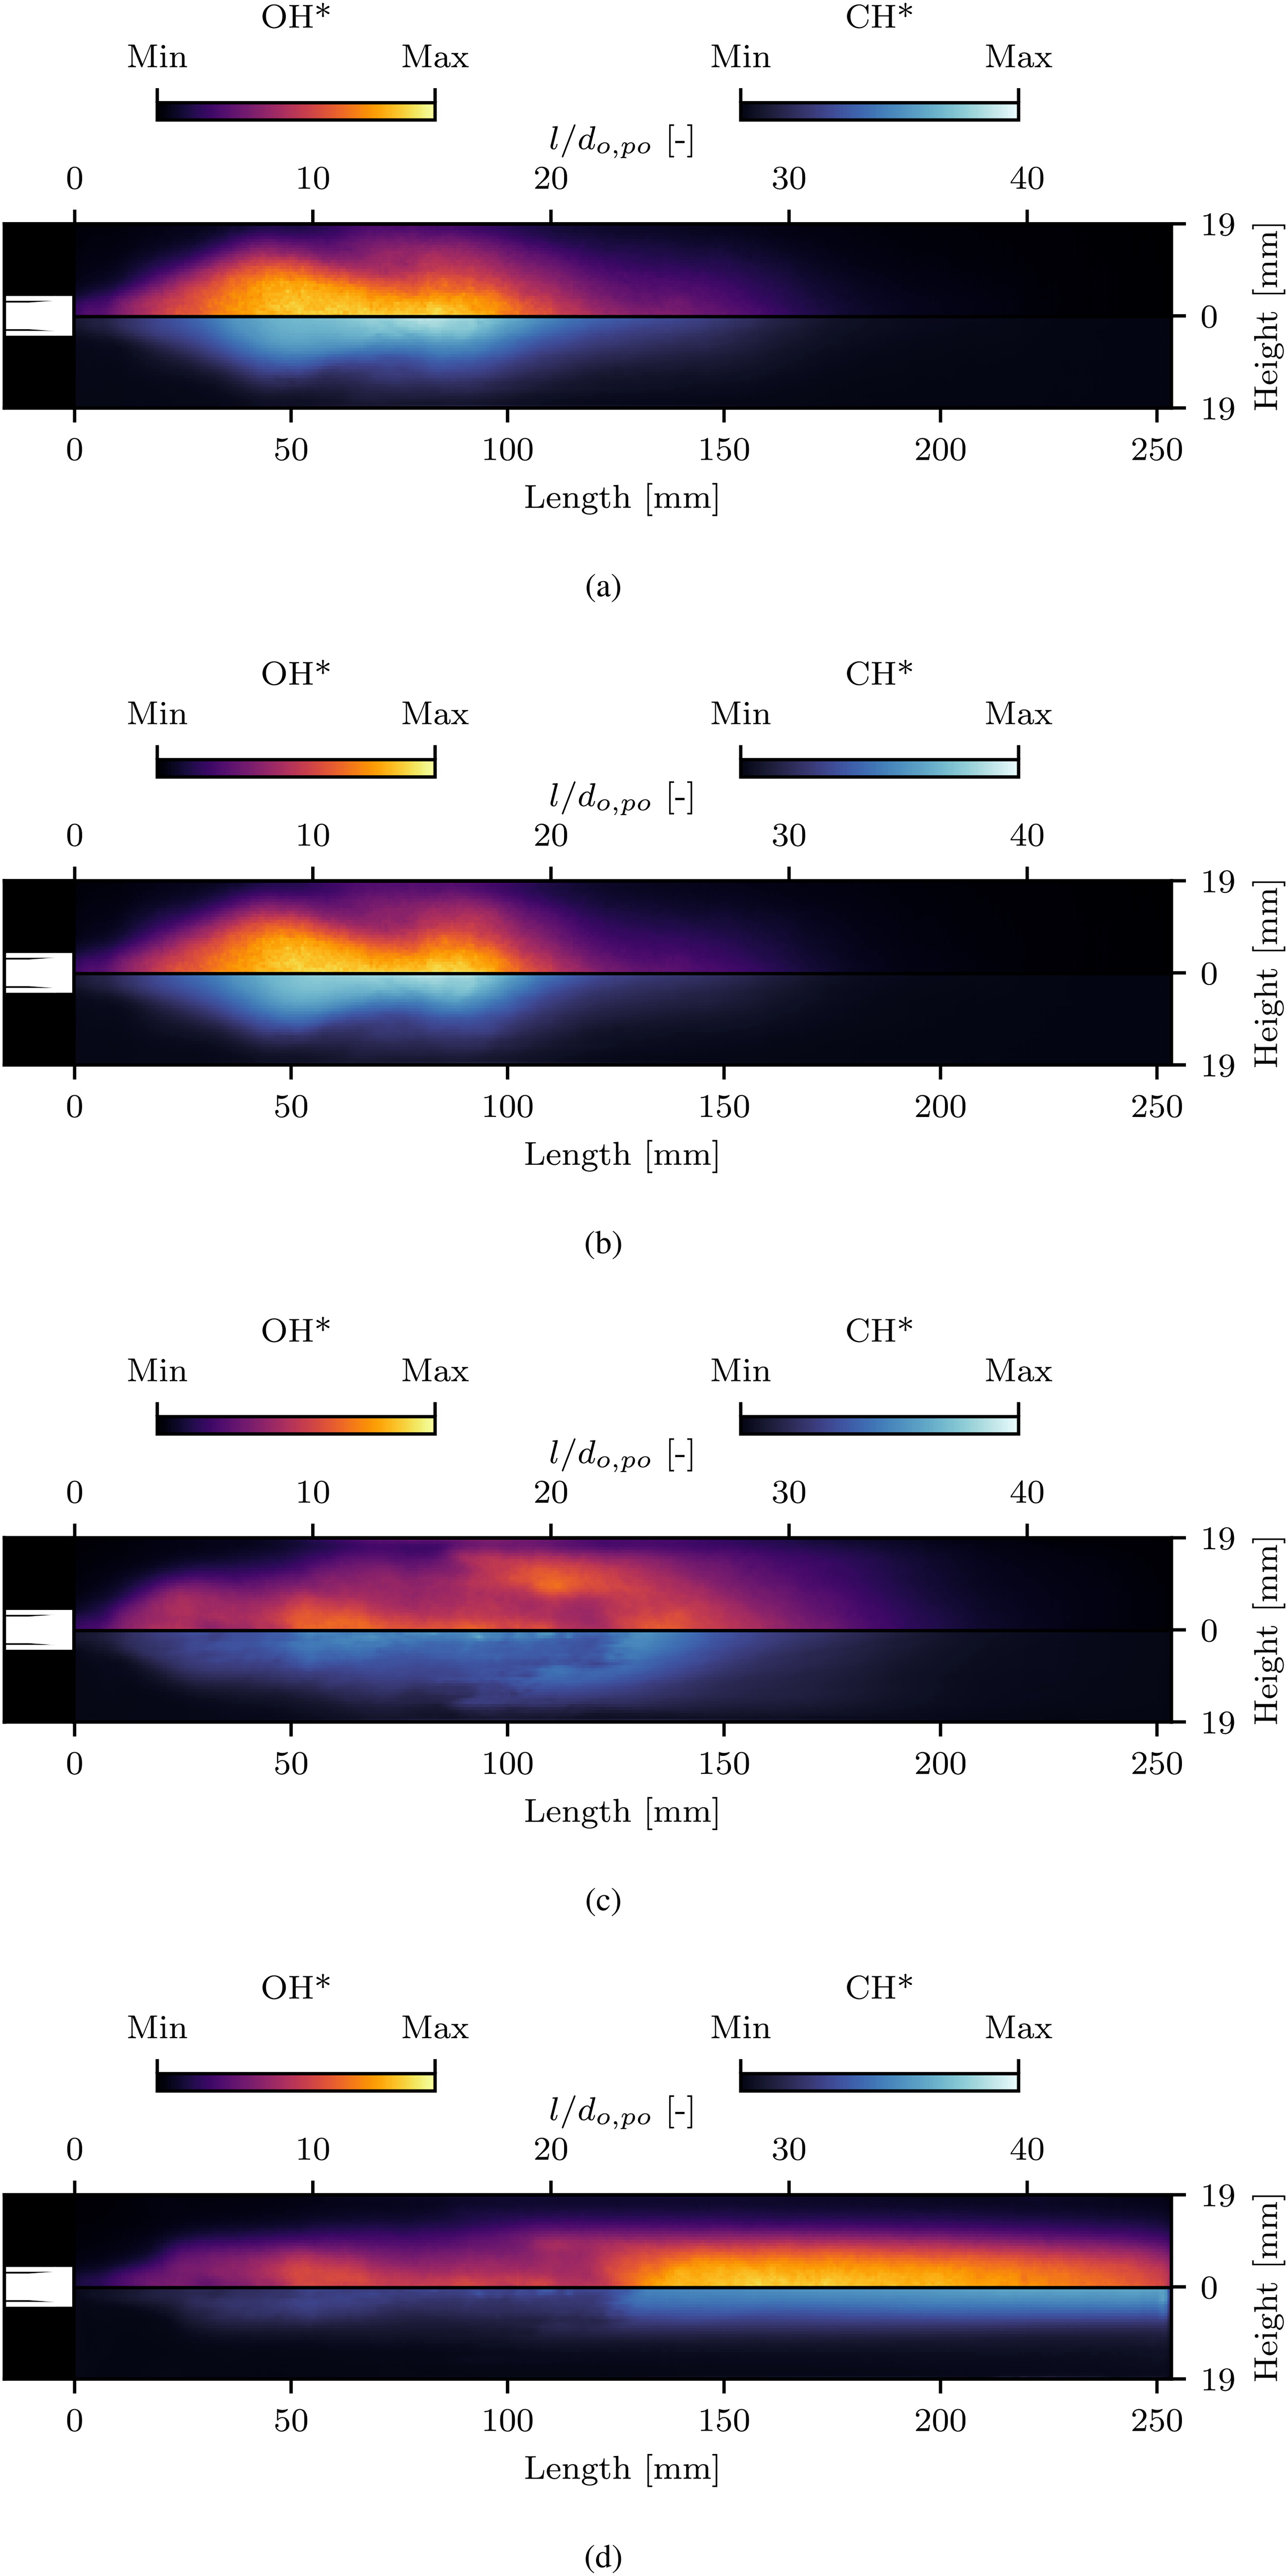
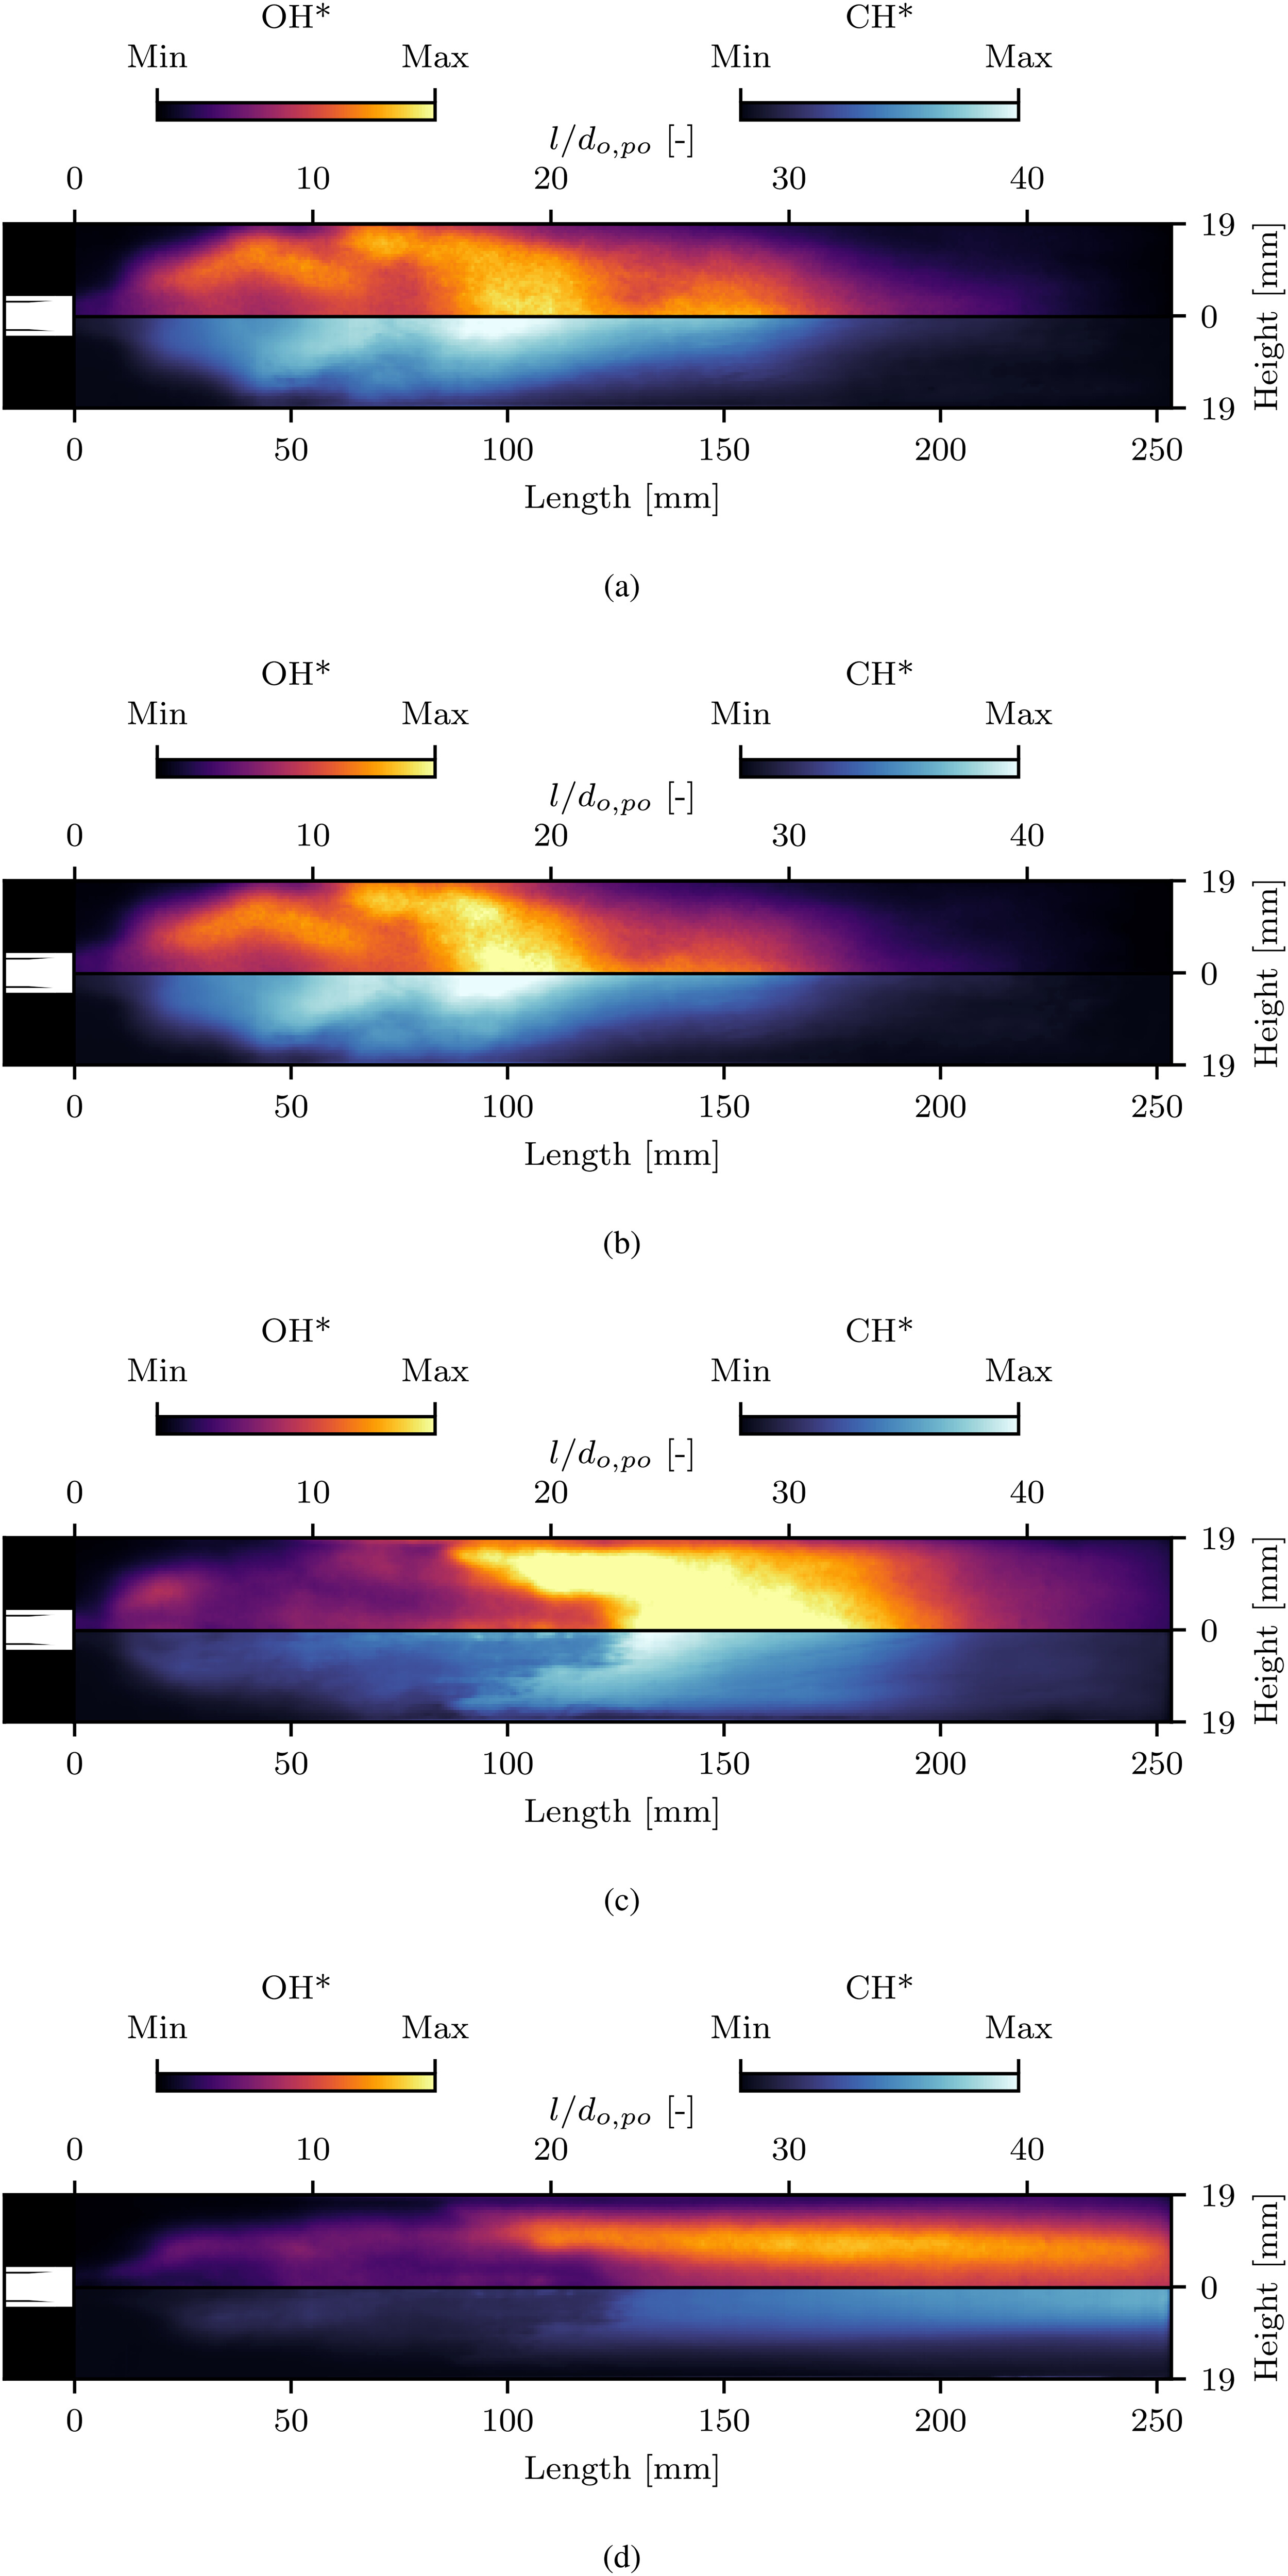
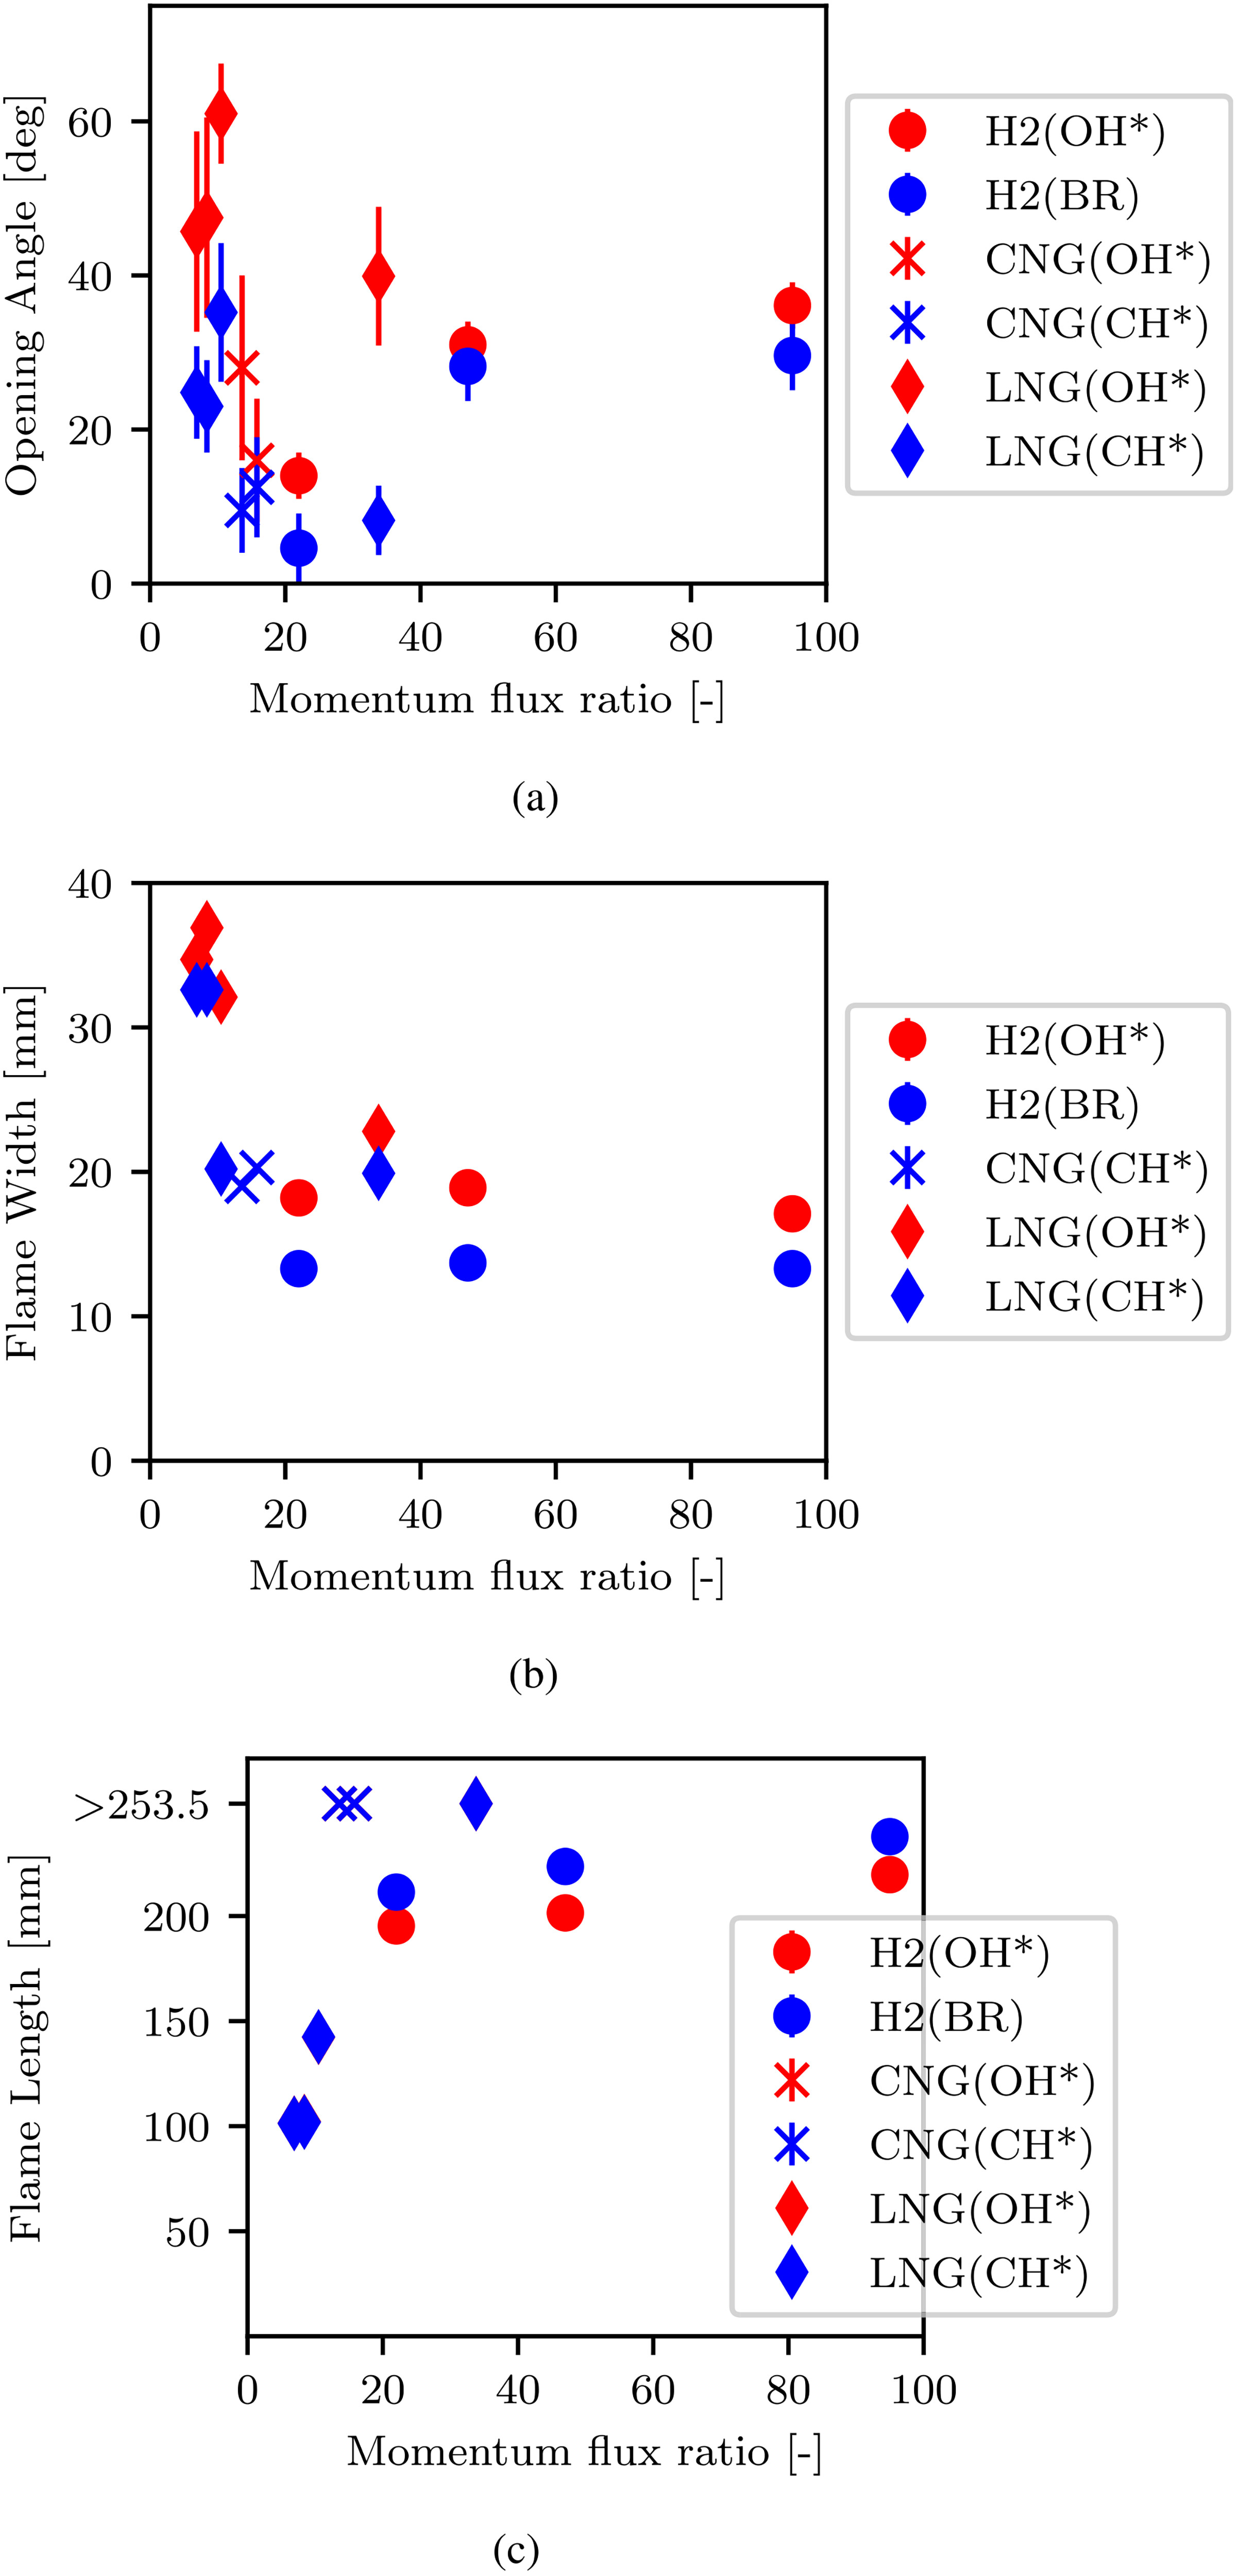
Features characterising the flame topology were derived from the time-averaged imaging and compared to previous experiments with the oxidiser-fuel combinations of LOX/CNG and LOX/H2. Here, the major influence of the longitudinal combustion instabilities on the flame opening angle and flame length were evident. While for unstable combustion the flame opening angle was significantly larger, the flame length was nearly half the length of previous more stable tests. This behaviour was also reflected in the hot gas and wall temperature measurements within the chamber. The hot gas temperature reached its peak between 100 and 150 mm downstream of the faceplate, corresponding to the end of the shortened flame, and then decreased towards the end of the chamber.
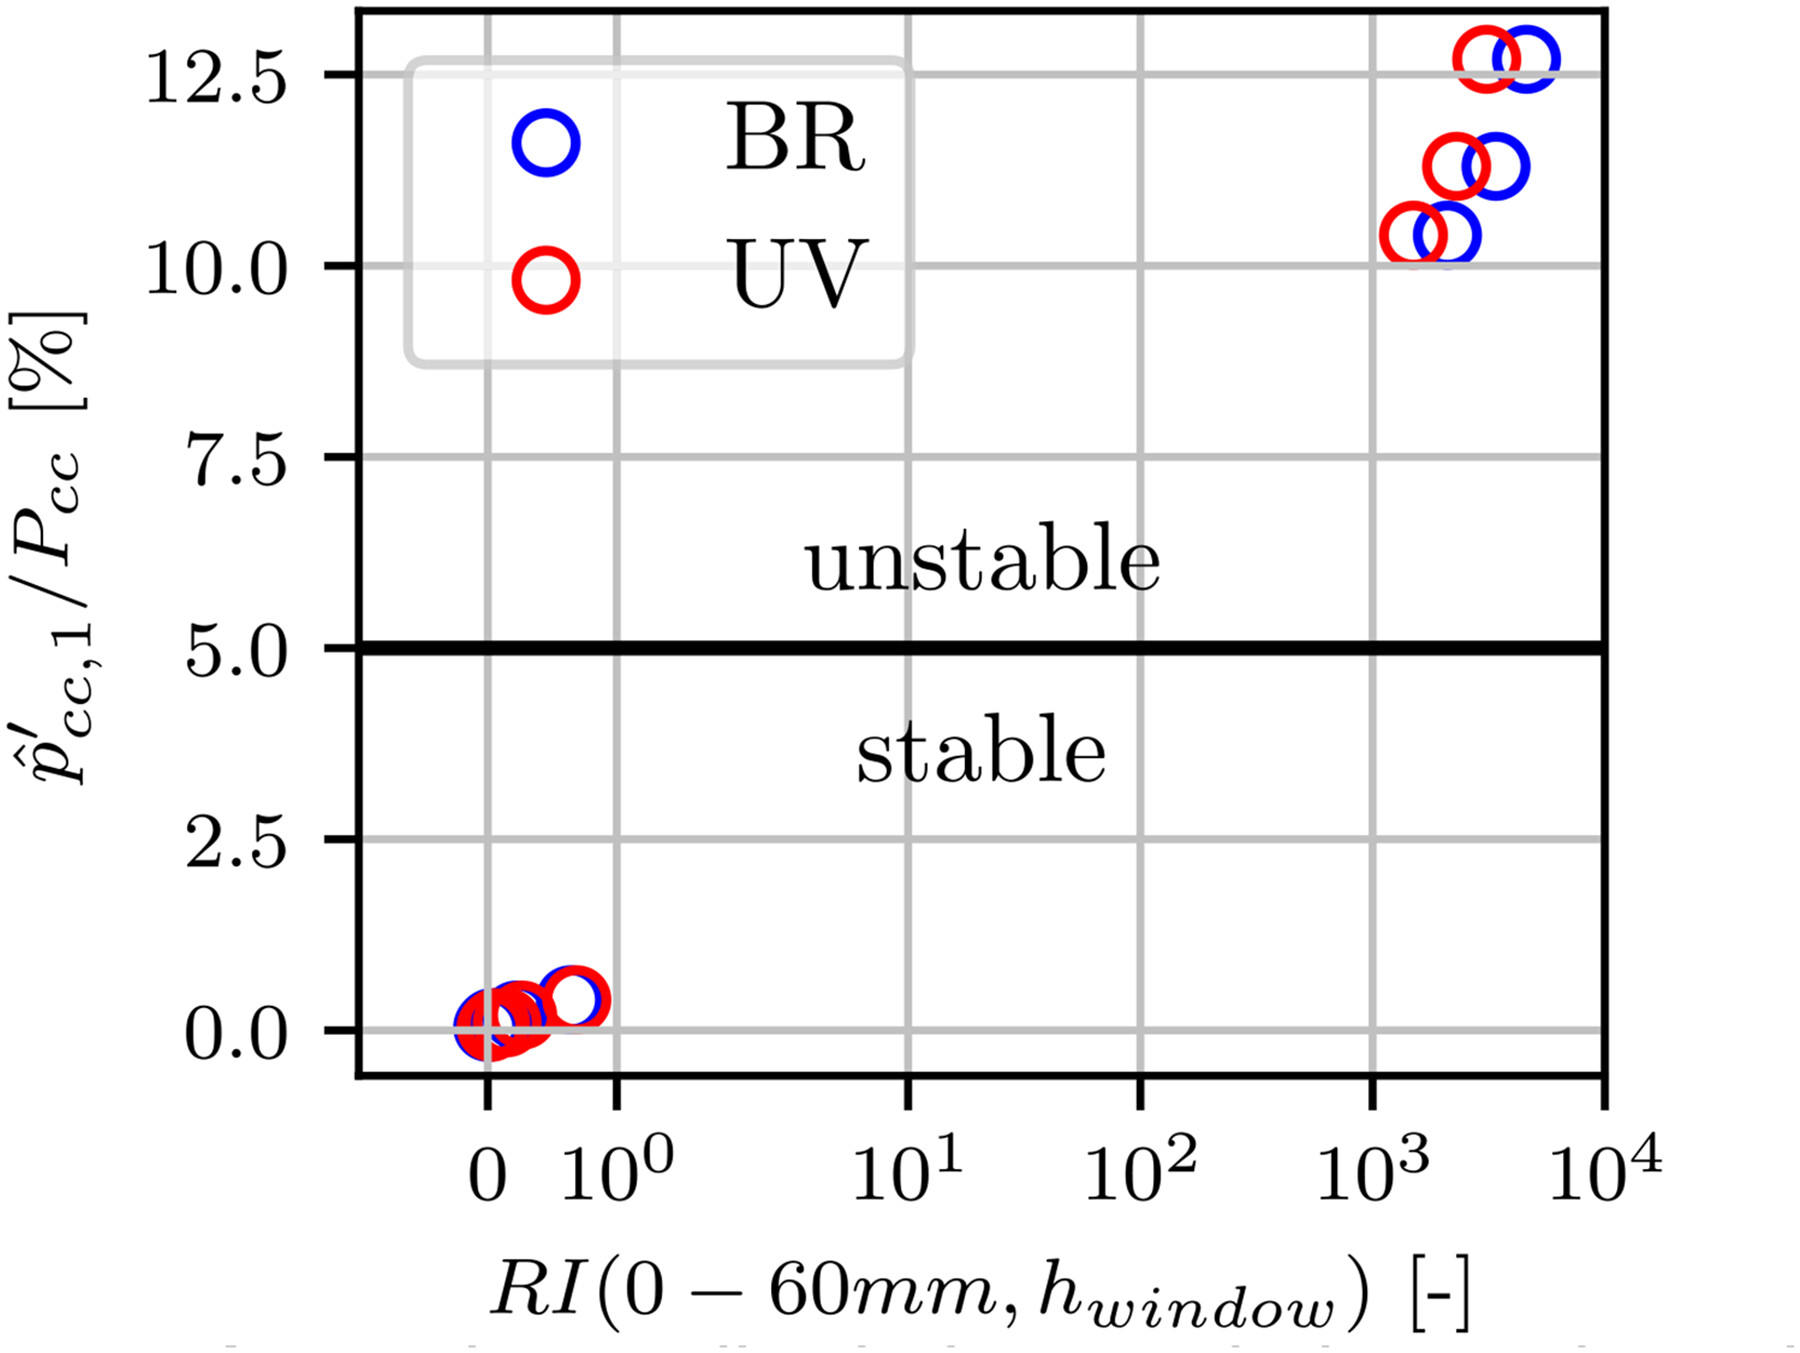
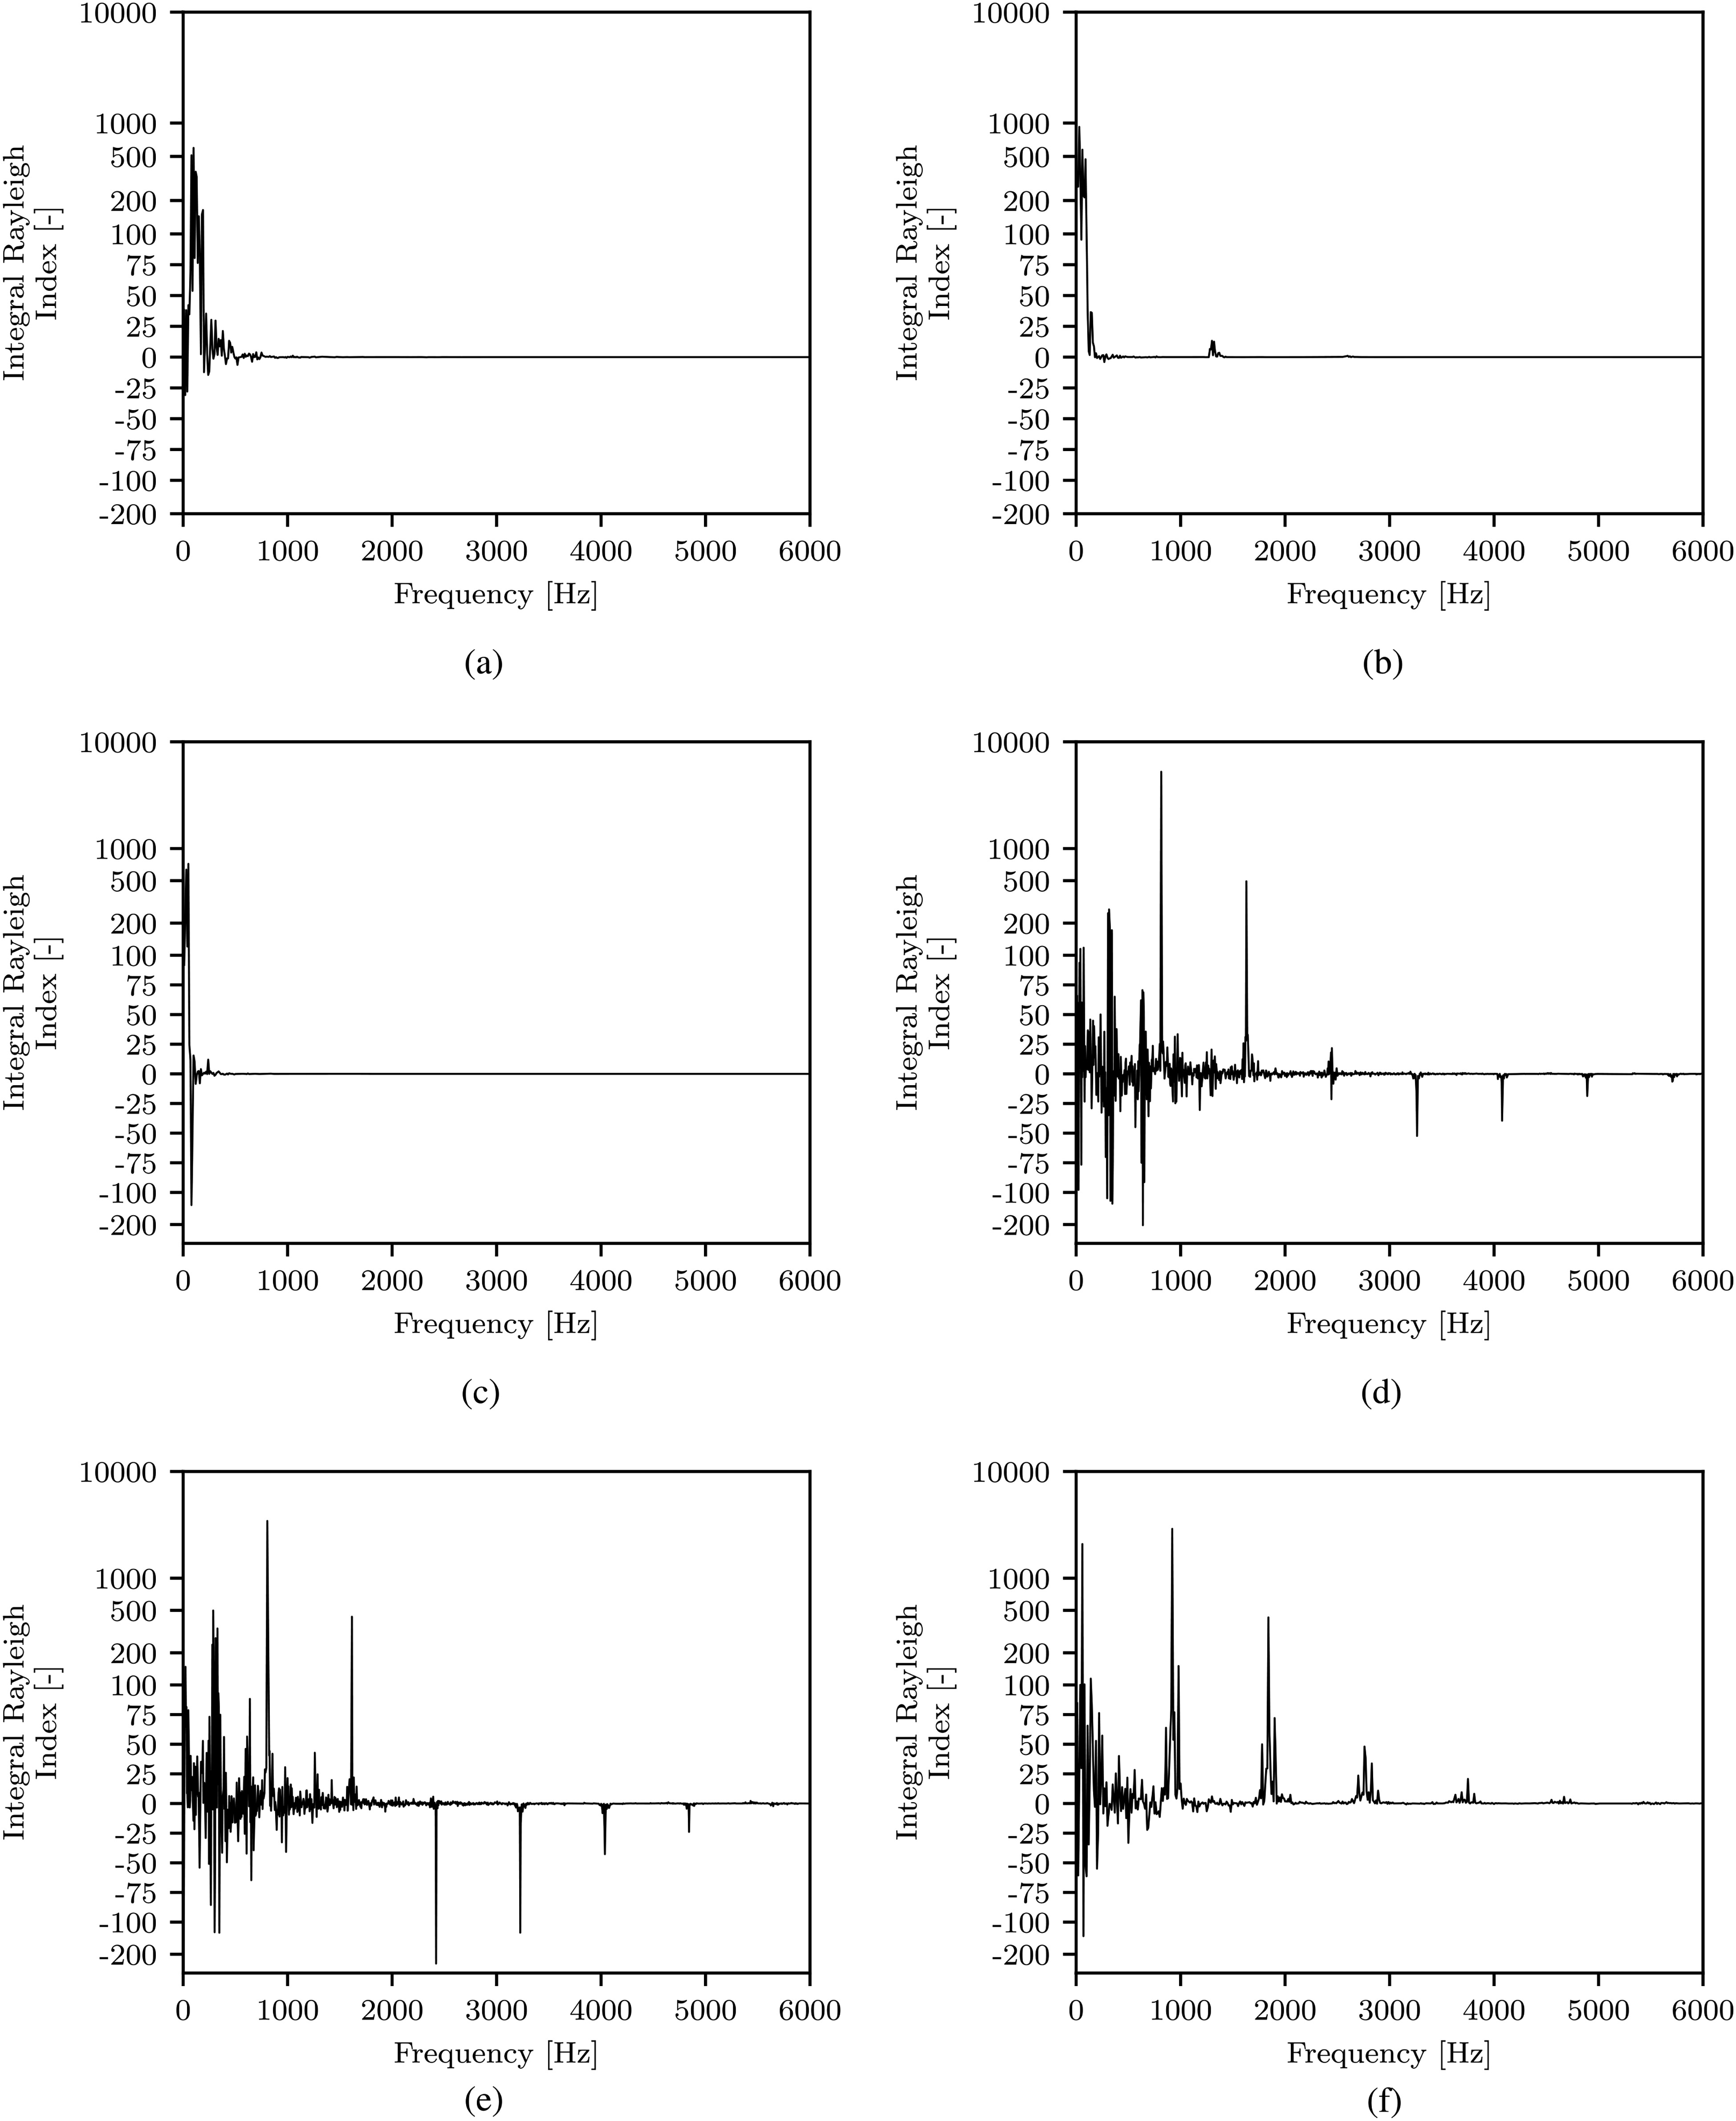
2D Rayleigh Index distributions were calculated using the acoustic field reconstructed from unsteady pressure measurements and the high-speed blue as well as ultraviolet radiation measurements. The distributions and integrated values reflect the observed state of thermoacoustic excitation of the chamber and shows the potential of OH* and especially CH* measurements as a qualitative marker for heat release rate. For the three unstable load points, a strong interaction between flame radiation intensity and acoustic pressure oscillations covering nearly the whole flame zone is determined. Comparison to previous experiments with the propellant combinations of LOX/CNG and LOX/H2 revealed consistent behaviour. Higher values of the integrated Rayleigh Index accompany higher normalised acoustic pressure amplitude. Integral Rayleigh Indices for the whole window area in dependence of frequency were also consistent with the thermoacoustic state of the chamber. If the Rayleigh criterion is satisfied, then the marker for heat release rate must be acceptable, at least within the uncertainty of phase. These data are hoped to serve the community in the validation of numerical tools for the prediction of combustion instability in LOX/LNG rocket engines.
The pressure bursts preceding the self-sustaining combustion instabilities in Test 2, in the literature referred to as intermittency,38 could indicate the operation of the combustor under bi-stable conditions. The changed operating conditions could, therefore, lead to changed boundary conditions in the chamber supporting the transition to self-sustaining, high-amplitude combustion instabilities. The precise circumstances leading to stable, intermittent, or unstable combustion is the subject of the ongoing investigation.

Acknowledgements

The work is associated with the DLR project of Advanced Methods for reusable Aerospace vehicle DEsign Using artificial intelligence and interdisciplinary numerical Simulation (AMADEUS) and Future Fuels. The authors would also like to thank the crew of the P8 test bench. Special thanks to Bernhard Knapp and Stephan General for their support with the optical setup and to Alex Grebe for his assistance in preparing and performing the experiments.

Declaration of conflicting interests

The authors declared no potential conflicts of interest with respect to the research, authorship, and/or publication of this article.

Funding

The authors received no financial support for the research, authorship, and/or publication of this article.

ORCID iDs

References

1. Huzel DK, Huang DH. Modern Engineering for Design of Liquid-Propellant Rocket Engines (Revised and enlarged edition). American Institute of Aeronautics and Astronautics, 1992.
2. Sutton GP, Biblarz O. Rocket Propulsion Elements. 8 ed. New York: John Wiley & Sons, 2010.
3. Kawashima H, Kobayashi T, Okita K. Progress of LE-9 engine development. In: AIAA Propulsion and Engery Forum, 2018 Joint Propulsion Conference. AIAA 2018-4458, Cincinnati, OH. doi:10.2514/6.2018-4458.
4. Rachuk V, Titkov N. The first Russian LOX-LH2 expander cycle LRE: RD0146. In: 42nd AIAA/ASME/SAE/ASEE Joint Propulsion Conference Exhibit. AIAA 2006-4904, Sacramento, CA: American Institute of Aeronautics and Astronautics. doi:10.2514/6.2006-4904.
5. Wang W, Zheng D, Qiao G. Development status of the cryogenic oxygen hydrogen YF-77 engine for long-March 5. In: 64th International Astronautical Congress (IAC). Beijing, China.
6. Ha D, Roh TS, Huh H, et al. Development trend of liquid hydrogen-fueled rocket engines (part 1: performance and operation). Int J Aeronaut Space Sci 2022.
7. Asakawa H, Nanri H, Aoki K, et al. The status of the research and development of LNG rocket engines in Japan. In Chemical Rocket Propulsion. Springer International Publishing, 2016. pp. 463–487. doi:10.1007/978-3-319-27748-6_19.
8. Simontacchi P, Blasi R, Edeline E, et al. Prometheus: precursor of new low-OST rocket engine family 2019. doi:10.13009/EUCASS2019-743.
9. Woo S, Lee J, Han Y, et al. Experimental study of the combustion efficiency in multi-element gas-centered swirl coaxial injectors. Energies 2020; 13: 6055.
10. Suslov DI, Hardi JS, Oschwald M. Full-length visualisation of liquid oxygen disintegration in a single injector sub-scale rocket combustor. Aerosp Sci Technol 2019; 86: 444–454.
11. Schmitt T, Staffelbach G, Ducruic S, et al. Large-eddy simulations of a sub-scale liquid rocket combustor: Influence of fuel injection temperature on thermo-acoustic stability. In 7th European Conference for Aeronautics and Aerospace Sciences (EUCASS) 2017. Milano, Italy. doi:10.13009/EUCASS2017-352.
12. Ma PC, Wu H, Ihme M, et al. Nonadiabatic flamelet formulation for predicting wall heat transfer in rocket engines. AIAA J 2018; 56: 2336–2349.
13. Lechtenberg A, Gerlinger PM. Numerical investigation of combustion instabilities in a rocket combustion chamber with supercritical injection using a hybrid rans/les method. In: AIAA Scitech 2020 Forum. doi:10.2514/6.2020-1162.
14. Martin J, Armbruster W, Stützer R, et al. Flame characteristics of a high-pressure LOX/H2 rocket combustor with large optical access. Case Stud Therm Eng 2021; 28: 101546.
15. Nunome Y, Onodera T, Sasaki M, et al. Combustion instability phenomena observed during cryogenic hydrogen injection temperature ramping tests for single coaxial injector elements. In 47th AIAA/ASME/SAE/ASEE Joint Propulsion Conference & Exhibit 2011. AIAA Paper 2011-6027, San Diego, California. doi:10.2514/6.2011-6027.
16. Kawashima H, Kobayashi K, Tomita T. A combustion instability phenomenon on a LOX/methane subscale combustor. In 46th AIAA/ASME/SAE/ASEE Joint Propulsion Conference & Exhibit 2010. AIAA Paper 2010-7082, Nashville, Tennessee. doi:10.2514/6.2010-7082.
17. Haeseler D, Mäding C, Preclik D, et al. Lox-kerosene oxidizer-rich gas-generator and main combustion chamber subscale testing. In: 2nd European Conference for Aeronautics and Aerospace Sciences (EUCASS).
18. Strunz R, Mäding C, Preuss A, et al. Design ant testing of closed cycle combustion devices within the future launcher preparatory programme. In: Space Propulsion.
19. Tamura H, Sakamoto H, Sasaki M, et al. An experimental study on the stability characteristics of the LOX /methane rocket combustor. In: 31st Joint Propulsion Conference and Exhibit. American Institute of Aeronautics and Astronautics. doi:10.2514/6.1995-2359.
20. Hardi JS, Hallum WZ, Huang C, et al. Approaches for comparing numerical simulation of combustion instability and flame imaging. J Propul Power 2016; 32: 279–294.
21. Fuller TL. Dynamic Coupling in a Model Rocket Combustor. PhD thesis, Purdue University, West Lafayette, Indiana, 2019.
22. Beinke SK. Anaylses of Flame Response to Acoustic Forcing in a Rocket Combustor. PhD thesis, The University of Adelaide, Australia, 2017. doi:10.25909/5b875ef6c13fb. School of Mechanical Enineering.
23. Richecoeur F, Scouflaire P, Ducruic S, et al. High-frequency transverse acoustic coupling in a multiple-injector cryogenic combustor. J Propul Power 2006; 22: 790–799.
24. Hardi JS, Beinke SK, Oschwald M, et al. Coupling of cryogenic oxygen-hydrogen flames to longitudinal and transverse acoustic instabilities. J Propul Power 2014; 30: 991–1004.
25. Fiala T, Sattelmayer T. Heat release and UV–vis radiation in non-premixed hydrogen–oxygen flames. Exp Fluids 2015; 56: 144.
26. Sardeshmukh S, Bedard M, Anderson W. The use of OH* and CH* as heat release markers in combustion dynamics. Int J Spray Combust Dyn 2017; 9: 409–423.
27. Knab O, Riedmann H, Ivancic B et al. Consequences of modeling demands on numerical rocket thrust chamber flow simulation tools, 2019. doi:10.1051/eucass/201911317.
28. Haberzettl A, Suslov D, Brümmer G, et al. European technology test facility for high pressure combustion P8. 20 years reserach and technology development. In: Deutscher Luft- und Raumfahrtkongress (DLRK) 2016. Braunschweig, Germany.
29. Fiala T. Radiation from High Pressure Hydrogen-Oxygen Flames and its Use in Assessing Rocket Combustion Instability. PhD Thesis, Technical University of Munich, Munich, Germany, 2015.
30. Fdida N, Vingert L, Ordonneau G, et al. Characterization of a double swirl injector in a LOX/LCH4 fueled combustor on mascotte test bench. In: 5th European Conference for Aeronautics and Space Sciences.
31. Martin J, Armbruster W, Hardi J. Flame-acoustic interaction in a high-pressure, single-injector, LOX/H2 rocket combustor with optical access. In: Symposium on Thermoacoustics in Combustion: Industy meets Academia (SoTiC 2021).
32. Martin J, Armbruster W, Suslov D, et al. Flame characteristics and response of a high-pressure LOX/CNG rocketcombustor with large optical access. In 33rd International Symposium on Space Technology and Science.
33. Kendrick D, Herding G, Scouflaire P, et al. Effects of a recess on cryogenic flame stabilization. Combust Flame 1999; 118: 327–339.
34. Martin J, Armbruster W, Suslov D, et al. Flame characteristics and response of a high-pressure LOX/CNG rocket combustor with large optical access. Aerospace 2022; 9: 410.
35. Fiala T, Sattelmayer T, Gröning S, et al. Comparison between excited hydroxyl radical and blue radiation from hydrogen rocket combustion. J Propul Power 2017; 33: 490–500.
36. Urbano A, Selle L, Staffelbach G, et al. Exploration of combustion instability triggering using large eddy simulation of a multiple injector liquid rocket engine. Combust Flame July 2016; 169: 129–140.
37. Schulze M. Linear Stability Assessment of Cryogenic Rocket Engines. PhD thesis, Technische Universität München, 2016. Institut für Energietechnik.
38. Nair V, Thampi G, Sujith RI. Intermittency route to thermoacoustic instability in turbulent combustors. J Fluid Mech 2014; 756: 470–487.