Intended for healthcare professionals
Open access
Research article
First published online January 24, 2026

Real-World Association of Lifestyle Reported Using Wearable Devices with Glycemic Excursions in People with Diabetes: The DiaGame Study

Abstract

Introduction:

The everlasting interest in precision medicine has instigated a need for personalized data collection. Consumer-grade wearable devices and applications can be used to support this need by collecting real-world data. In this article we describe how we collected multimodal data using a consumer-grade continuous glucose monitor, smartwatch with in-house application, and smartphone application in people with diabetes; analyzed data quantity and quality; and evaluated the association of lifestyle variables with glycemic excursions.

Methods:

Data were collected for 14 days on interstitial glucose concentration, heart rate, acceleration, step count, dietary intake, bouts of physical activity, insulin administration, and mood. Sixty participants were included (52 with type 2 and 8 with type 1 diabetes), with mean (±standard deviation) age of 66.8 ± 10.3 years and BMI of 29.4 ± 4.9 kg/m2.

Results:

In total, we collected 77,683 CGM measurements, 4073 moods, 3517 meals, 1394 insulin injections, and 1364 bouts of physical activity. Fifty-nine (98.3%) participants finished the study, 45 participants (75.0%) reported data of every modality, and each modality was logged by most participants for at least 9 days. Furthermore, excursions in the glucose levels were significantly associated with dietary intake and indirectly insulin dosing, whereas no association with mood or physical activity was observed.

Conclusions:

These findings highlight the effectiveness of consumer-grade wearable devices to collect data from the comfort of the people’s homes and illustrate the potential to continuously evaluate the relationship between lifestyle and health at an individual level.

Introduction

The emergence of precision or personalized medicine, which seeks to improve diagnosis, prediction, prevention, and treatment by focusing on the individual rather than on groups of people, has instigated a need for patient-specific multidimensional data to evaluate an individual’s health, well-being, and environment. Diabetes mellitus is one example of a disease for which precision medicine approaches may be beneficial due to the recognized heterogeneity in its etiology, clinical presentation, and pathogenesis.1 The resulting need for patient-specific multidimensional data collection (precision monitoring) has been highlighted in the latest American Diabetes Association and European Association for the Study of Diabetes consensus, along with other publications, that advocated for precision monitoring methods as the next crucial step toward precision medicine for diabetes.1,2 Precision medicine in the field of diabetes research focuses on elucidating pathophysiological processes (molecular and environmental), and consequently the heterogeneity in glycemic dynamics, that underlie the disease. Although the primary cause of dysregulated glycemic dynamics concerns defects in at least one physiological pathway, multiple coherent factors including self-regulated behavior (e.g., dietary intake and physical activity) and health (e.g., medication and psychological status) also influence glycemic dynamics. Furthermore, lifestyle, defined by the long-term combination of these variables, impacts the risk for future complications.37
To capture glycemic variations, gain insight into the underlying glycemic effects of lifestyle, and ultimately monitor disease progression, all at an individual level, the availability of data is imperative. Although data measured in clinical and research settings are well controlled, detailed data collection over weeks or months of time is unfeasible from these settings and difficult to scale to large cohorts. Consequently, a transition must be made toward data measured in the comfort of people’s homes and throughout their daily lives. Furthermore, data from free-living conditions are representative of self-regulated behavior and habits, thereby offering the opportunity to capture the day-to-day glycemic variability typical for diabetes. The shift from clinical settings toward the real-world is enabled by the advent and enhancement of wearable devices. The continuous glucose monitor (CGM) has already provided tremendous insight into glycemic control for clinicians and people with diabetes.8 Furthermore, smartphones and smartwatches have been shown to be promising for the monitoring of lifestyle variables.9,10
The use of wearable devices in diabetic populations for data collection in free-living conditions has, except for a few studies, been mostly limited to the effects on blood glucose levels of physical activity, diet, or psychological stress alone. Of the few studies that simultaneously collected data on a broader range of variables, nearly all of these studies have been conducted on individuals with type 1 diabetes. Sample sizes in these studies ranged from 9 to 497 participants, with study periods of up to 8 weeks, and measurements on blood glucose levels, exercise, insulin dosing, dietary intake, heart rate, psychological status, electrocardiograms, breathing, and accelerometers.1114 Similar studies in people with type 2 diabetes are even rarer, with two studies (94 and 14 subjects with non-insulin-treated type 2 diabetes) collecting data on blood glucose levels, dietary intake, heart rate, and accelerometer-derived step count.15,16
Data collection in free-living conditions can be burdensome for the participants and researchers, especially when using analog data collection methods (i.e., paper logbooks and questionnaires). The data collection process often requires data digitization, structuring, and manual preprocessing. Some studies also relied on participants or experts to acquire information on dietary macronutrient composition.12,13 By integrating multiple wearable devices and applications, some of the burdens of data collection in the real world can be alleviated. The use of wearable devices negates the need for data inference and digitization. Moreover, the use of specifically consumer-grade wearable devices, rather than research-dedicated devices, offers a cost-effective, scalable, and readily available method of collecting data due to the widespread ownership of smartphones and the increasing popularity of smartwatches and fitness trackers. The consumer-grade wearable devices, used in this study, included a CGM for continuous blood glucose measurements, a smartphone application to collect patient-reported dietary intake and physical activity, and a smartwatch with in-house application to measure heart rate, acceleration, and step counts and collect participant-reported mood and insulin dosing.
This article describes the use of commercially available, consumer-grade wearable devices and applications in the DiaGame Study to collect data under real-world conditions in people with diabetes, predominantly type 2 diabetes. We provide an overview of the types, quantity, and quality of data collected. We subsequently investigate whether dietary intake, insulin dosing, physical activity, and mood (from here onwards referred to as lifestyle factors) are associated with glycemic excursions (defined by peaks in the CGM signal) in people with type 1 diabetes, insulin-naïve type 2 diabetes, and insulin-dependent type 2 diabetes.

Methods

Study design and participants

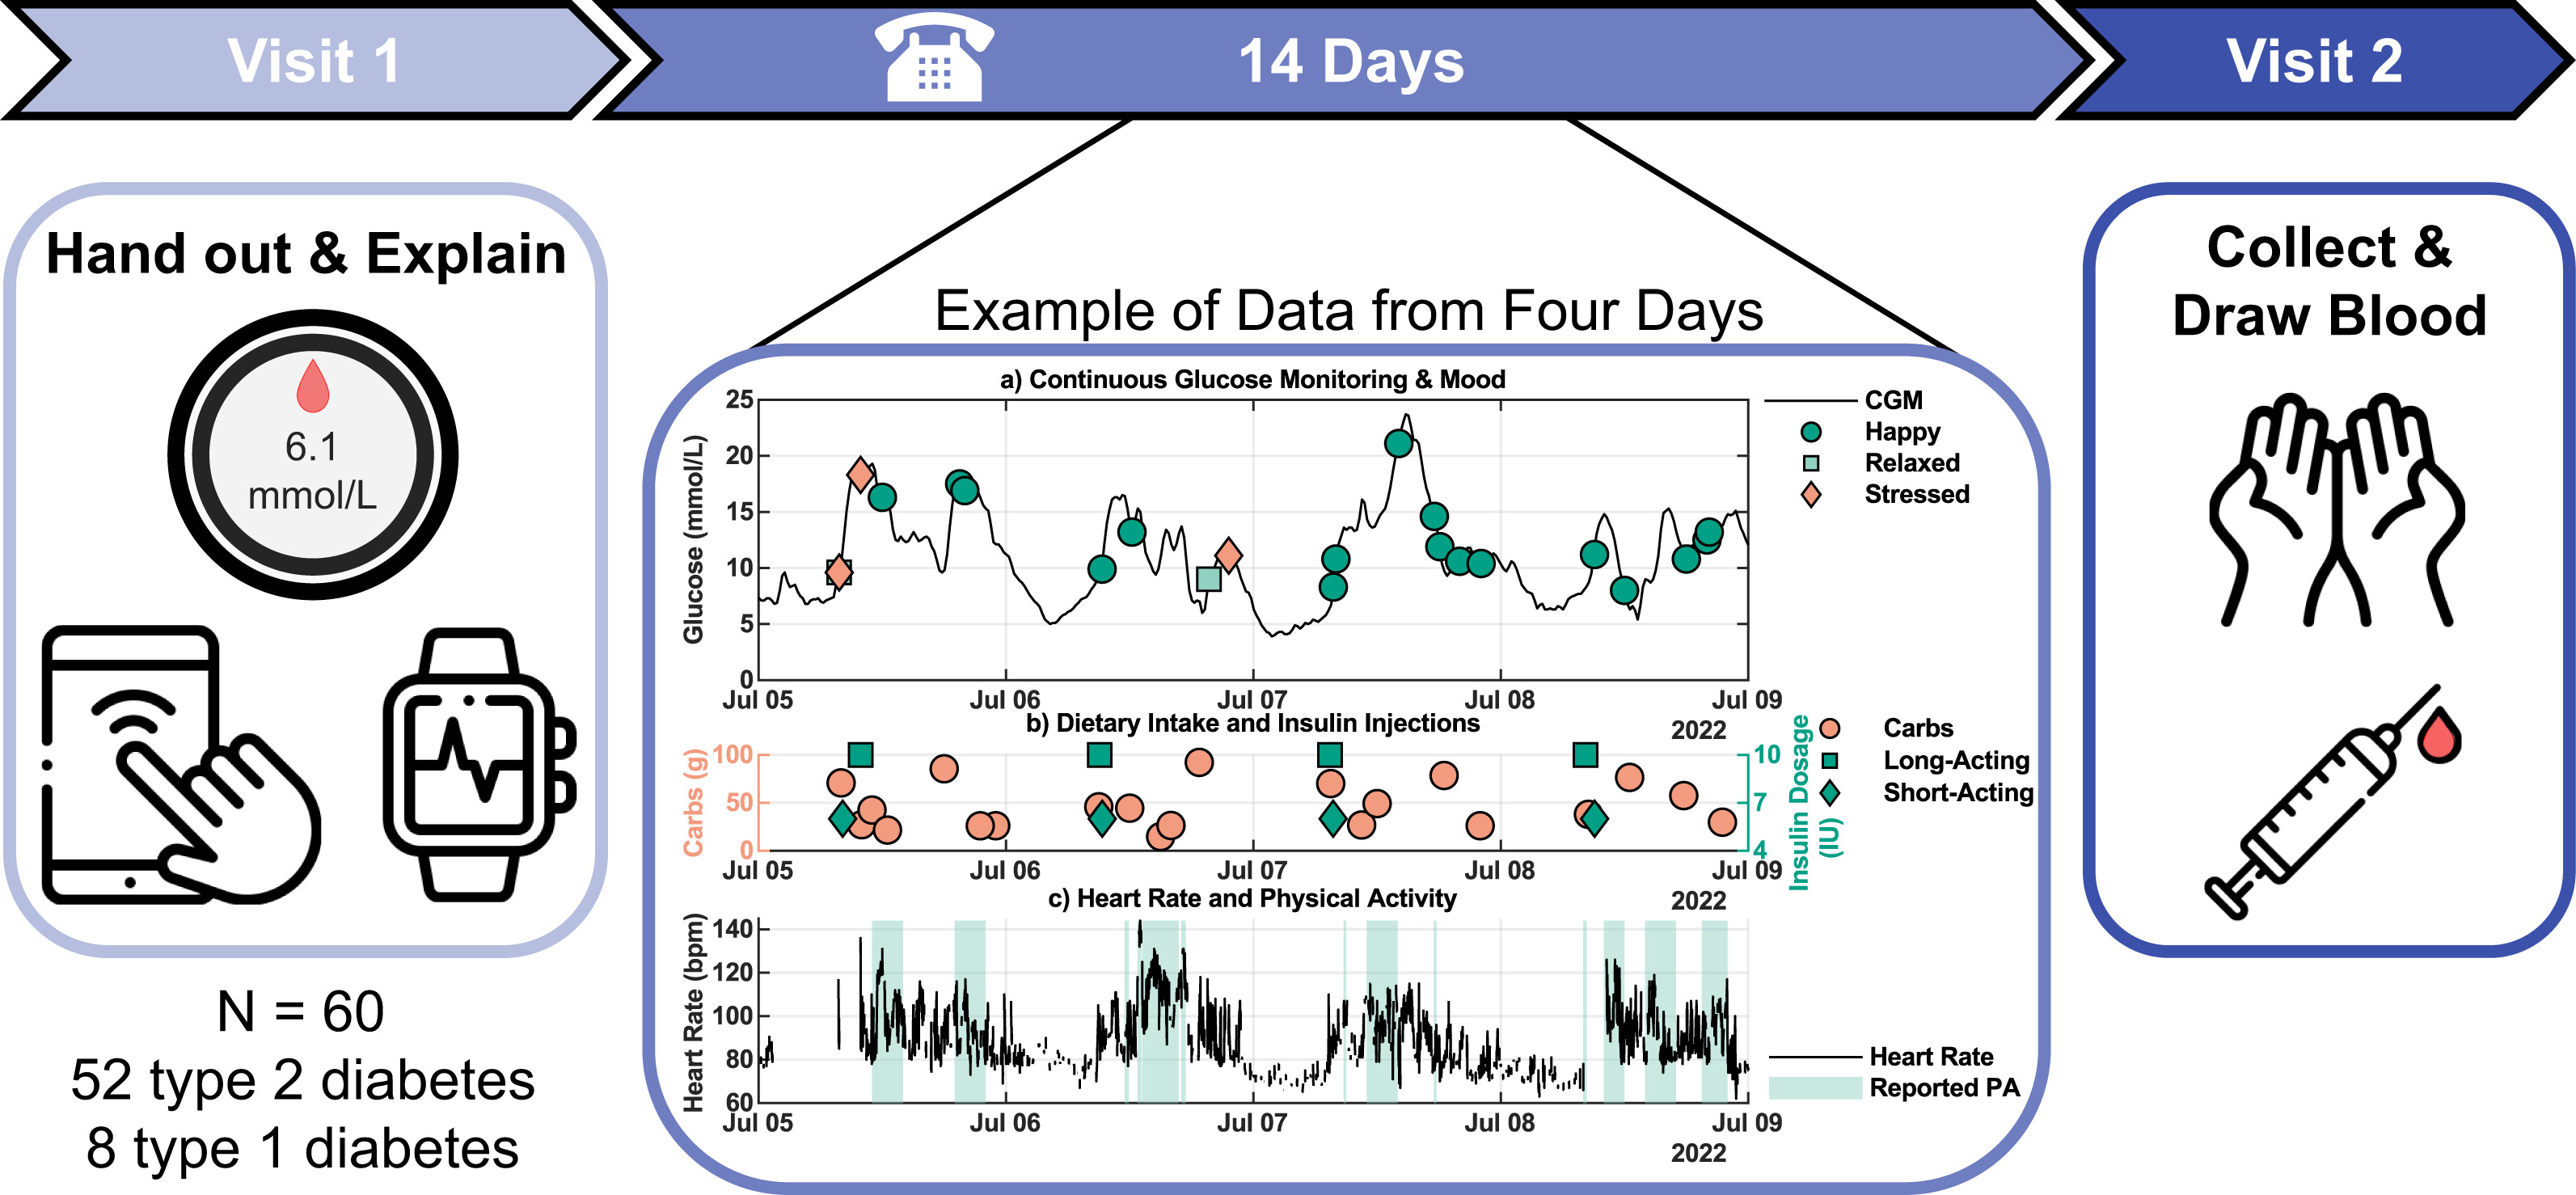
Between June 2022 and June 2023, 60 participants (type 1 and type 2 diabetes) were included, and data were collected over a consecutive 14-day period. All participants were recruited from the outpatient clinic of the Máxima Medical Center (The Netherlands). Participants were eligible for inclusion when they met the following criteria: (I) diagnosis of type 2 diabetes or type 1 diabetes (body mass index [BMI] <30 kg/m2 for type 1 diabetes), (II) age >18 years, and (III) possession of a smartphone that runs the required application. Exclusion criteria comprised (I) pregnancy or breastfeeding, (II) ongoing treatment for malignancy, (III) scheduled Magnetic Resonance Imaging (MRI) scan during the study, and (IV) non-Dutch speaking. All individuals provided written informed consent. The study was registered in the Dutch Trial Registry (NL9290), approved by the Medical Research Ethics Committee Máxima MC (nr. L20.102), and conducted according to the principles of the Declaration of Helsinki.
Participation consisted of two visits to the clinic and a telephone call. During the first visit, a brief overview of the participant’s medical history was registered, along with medication use. Subsequently, blood pressure, resting heart rate, weight, and length were measured, and a blinded CGM was applied. Finally, participants received a smartwatch with preinstalled study application and were instructed on how to download the smartphone application and use the devices.
Four to six days after the first visit, participants were contacted by telephone to address specific issues identified through a remote assessment of data reported on dietary intake and physical activity. Instructions were reiterated if necessary. Subsequently, after 14 days, participants returned for the second visit in a fasted state to draw blood and return all devices. The data on these devices were subsequently pseudonymized and exported to a secure database.

Data collection

Glucose concentrations were measured using a FreeStyle Libre Pro iQ sensor (Abbott Diabetes Care, Illinois, USA), a blinded CGM that measured interstitial glucose levels every 15 min, 24 hours per day, for 14 consecutive days. Glycated hemoglobin (HbA1c), fasting glucose, and C-peptide concentrations were measured using the standard protocol of the hospital’s clinical chemical laboratory.
Participants received a Samsung Galaxy Watch 2 Active 44 mm smartwatch during visit 1, preinstalled with the developed application (built for the Tizen mobile operating system). The application allowed participants to report mood and insulin dosing and automatically recorded measurements from the internal sensors (heart rate monitor, pedometer, and triaxial accelerometer). First, (insulin-dependent) participants were instructed to self-report the type of insulin injected (short-acting, long-acting, or mixed insulin), dose, and time of injection through the dedicated screen. Second, participants were nudged four times a day at fixed times (8 AM, 12 PM, 6 PM, 8 PM) through short vibrations and activation of the smartwatch showcasing the dedicated mood screen. The screen provided the option of five moods with matching emojis: happy, relaxed, stressed, angry, and sad. Participants were instructed to respond to these nudges and to report their mood when they perceived a change in their mood. Nonetheless, participants retained autonomy to report mood at any time via the application. An overview of the smartwatch application can be seen in Supplementary Fig. S1.
Dietary intake, both food and beverage consumption (excluding water, tea, and coffee without any additives), and physical activity were self-reported every day through the Mijn Eetmeter smartphone application (translates to “My Eating Meter”) on the participant’s smartphone (Voedingscentrum, The Hague, The Netherlands).17 Reporting dietary intake required participants to enter the meal moment (breakfast, lunch, dinner, and snacks in between these meal moments), meal contents, and amounts of these meal contents. Options for meal contents are synchronized with the Dutch Food Composition Information Portal (NVIP) from the Dutch National Institute for Public Health and the Environment.18 The application often provides predefined portion sizes per product (e.g., one standard serving of a product or the distinction between a small, medium, or large portion with an indicated weight) next to the option to report the weight of the product. Instructions were given to report mealtimes in an adjacent text field that listed the different meal moments. Furthermore, participants were instructed to report physical activity in the application. This action consisted of selecting the type of activity from a wide range of possibilities (from walking to cleaning the house), the duration of the activity, and noting the starting time in a text field. For an impression of the application, see Supplementary Fig. S2.

Data security

Participants were provided with preset study Mijn Eetmeter accounts to promote data security and privacy, aligning with the General Data Protection Regulation. In addition, the smartwatch and CGM operated offline during the study period.

Statistical analysis

The association between glycemic excursions and lifestyle variables was evaluated by determining whether peaks in the CGM signal were preceded, within a 2-hour window, by a logged meal, insulin dose, physical activity, or mood. CGM data were first smoothed using a third-order Savitzky-Golay filter (frame length of 7), and peaks were identified using MATLAB R2024a’s findpeaks algorithm.19 Days with reported caloric intake below 1000 kcal were excluded. To assess whether the observed associations were greater than expected by chance, a control window from 2.5 to 4.5 hours prior to each peak (nonoverlapping with any test window) was defined. For each lifestyle variable, the proportion of test versus control windows containing a respective log entry was compared using a nonparametric one-sided Wilcoxon rank-sum test. Bonferroni correction was applied to adjust for multiple comparisons (α = 0.05). Furthermore, associations between lifestyle factors and CGM peaks were quantified using mixed-effects logistic regression models. Odds ratios (ORs) for each lifestyle factor were estimated by including all lifestyle variables simultaneously as fixed effects, while accounting for repeated measurements and time-invariant confounders within individuals via participant-level random intercepts. Both analyses were stratified by diabetes type and insulin therapy: type 1 diabetes, insulin-naïve type 2 diabetes, and insulin-dependent type 2 diabetes to account for differences in insulin therapy.
The wearing of the smartwatch was determined by the presence of a valid (positive value) reading of the heart rate sensor within 1 min of nudging. Response percentage was defined as the percentage of responses to a nudge within 5 min of the nudge, given the smartwatch was worn according to the previous heart rate criterion. 95% binomial proportion confidence intervals (CIs) were calculated using Clopper–Pearson “exact” CIs, unless stated otherwise.

Results

Participant characteristics

Upon study completion, 59 participants (35 males and 24 females) were included (excluding one dropout due to multiple CGM malfunctions). For one participant, CGM data of her own prescribed CGM were voluntarily provided due to device malfunction. Fifty-one participants were diagnosed with type 2 diabetes and 8 with type 1 diabetes, with respective mean (±standard deviation, SD) ages of 69.1 (±7.1) and 54.6 (±16.9) years, mean BMIs of 30.1 (±4.9) and 25.4 (±3.3) kg/m2, mean diabetes durations of 20.5 (±7.3) and 26.6 (±13.4) years, mean HbA1c’s of 61.5 (±11.7) and 63.4 (±15.0) mmol/mol, and mean time in ranges (3.9–10.0 mmol/L) during the study of 66.8% (±22.7) and 62.7% (±21.6). For a complete overview of participant characteristics (e.g., insulin and medication usage, anthropometric measurements, and fasting blood values), stratified by diabetes type, see Table 1.
Table 1. Participant Characteristics Stratified by Diabetes Type
DemographicsMean ± standard deviation
Type 2 diabetes
(n = 51)
Type 1 diabetes
(n = 8)
General
 Male323
 Female195
 BMI (kg/m2)30.1 ± 4.925.4 ± 3.3
 Age (years)69.1 ± 7.154.6 ± 16.9
 HbA1c (mmol/mol) (95% CI)61.5 ± 11.7 (58.2–64.8)63.4 ± 15.0 (50.8–75.9)
 HbA1c (%) (95% CI)7.8 ± 1.1 (7.5–8.1)8.0 ± 1.4 (6.8–9.1)
 Systolic blood pressure (mmHg)133 ± 16128 ± 13
 Diastolic blood pressure (mmHg)73 ± 876 ± 4
 Resting heart rate (bpm)75 ± 1781 ± 12
 Diabetes duration (years)20.5 ± 7.326.6 ± 13.4
 Fasting glucose (mmol/L)7.8 ± 2.5a10.7 ± 4.0
 Fasting C-peptide (nmol/L)0.69 ± 0.44a (1 BLOQ)0.10 ± 0.14 (5 BLOQ)
 Time in range during the study (%) (95% CI)66.8 ± 22.7 (60.4–73.2)62.7 ± 21.6 (44.6–80.7)
 Daily insulin per kg bodyweight (IU/kg/day)0.45 ± 0.450.44 ± 0.20
Insulin analogues and medication
 Insulin aspart177
 Insulin lispro21
 NPH insulin21
 Insulin glargine90
 Insulin detemir20
 Insulin degludec255
 Mixed insulins10
 Insulin pump therapy12
 Metformin411
 SGLT2 inhibitors170
 GLP-1 agonist230
 Sulfonylureum derivatives250
an = 58, as one participant had not fasted the morning of visit 2. BLOQ, below limit of quantification (0.03 nmol/L for C-peptide); these values were imputed with half of the detection limit concentration to calculate the corresponding presented statistic.
Time in Range is defined by the percentage of times CGM values were between 3.9 and 10.0 mmol/L. 95% Confidence intervals are reported for key clinical metrics (HbA1c and Time in Range).
BMI, body mass index; CI, confidence interval.

Data quantity

The set of wearable devices provided a large extent of multimodal data. An example of 4 days of collected data is shown in Figure 1, including sensor measurements of interstitial glucose concentrations and heart rate as well as self-reported mood, insulin analogue injections, dietary intake, and physical activity. In total, the dataset includes 77,683 CGM measurements, 4073 self-reported moods, 3517 meals, 1394 insulin injections, and 1364 bouts of physical activity. Excluding days of study visits, interstitial glucose levels were measured (every 15 min) in 97.5% of measurement instances. A daily energy intake of at least 1000 kcal/day was reported on 80.6% of study days (one participant was excluded due to a self-described crash diet), while at least 1000 steps a day were recorded on 93.0% of study days (excluding one wheelchair-bound participant). 96.6% of participants self-reported their mood, and 84.1% of insulin-dependent participants (n = 44) reported insulin doses. 84.5% of participants had self-reported physical activity. In total, 45 participants (76.3%) managed to self-report data of every modality (including insulin doses when prescribed).
FIG. 1. Study workflow with an example of 4 days of data collected from one participant. Panel A: CGM measurements (in mmol/L, solid black line) and reported moods (dark green circle = happy, light green square = relaxed, light red diamond = stressed; sad and angry were not reported by this participant in this interval). Panel B: Carbohydrate content (in grams) of reported dietary intake (light red circles) and reported short-acting (dark green diamonds) and long-acting (dark green circles) insulin doses (IU). Panel C: Measured heart rate in beats per minute (solid black line) and participant-reported bouts of physical activity (light green shade). Accelerometer and pedometer data were excluded from this figure for clarity. CGM, continuous glucose monitor.
Further analysis demonstrated participants were consistently engaged (i.e., they reported data) with the applications and smartwatch during the study period, only with a slight decrease in physical activity reporting at the start of the study (Supplementary Fig. S3). The number of days of data collected per participant for each modality, as shown in Figure 2 by the distribution of days with data collected during the study, varies between participants. Excluding visit days, dietary intake had been reported for 11–13 days by all participants (67.8% with a daily energy intake greater than 1000 kcal/day). For most participants (54.2%), physical activity data were reported for between 9 and 13 days, while 27.1% of participants reported only one or no day of physical activity. The distribution of days of physical activity data was similar to the distribution of days with a step count of at least 3000 steps. Data on self-reported mood were available per participant anywhere between zero (3.4%) and 13 (22.0%) days, with at least 10 days of mood data for more than half (50.8%) of the participants. Insulin dosing data per insulin-dependent participant were available for 11–13 days for 70.5% of participants, while no insulin dosing data were available for 7 out of 44 (15.9%) participants (only one of these seven used rapid-acting insulin). In total, 59 out of 60 (98.3%) participants finished the study, 45 participants (75.0%) reported data of every modality, and data are available on each modality for a majority of participants for at least 9 days.
FIG. 2. Distribution of available days of collected data per participant for various data modalities. Distribution of the total number of days, excluding days of study visits, with collected data per participant for each of the data modalities. Panel A: Distributions of available CGM measurements (including all days = light green, including days with at least 90% of CGM time points = dark green). Panel B: Distributions of self-reported dietary intake (including all days = light green, including days with at least 1000 kcal reported = dark green). Panel C: Distributions of self-reported physical activity (red) and days with at least 3000 steps (green). Panel D: Distributions of self-reported mood (red) and insulin injection doses (green, n = 44 since not all study participants were insulin dependent).

Data quality

Evaluation of the quality of the patient-reported data showed mixed results, as data were consistently reported but not always to the extent that it matched our expectations of a complete day of lifestyle events. A comparison of reported dietary intake and daily insulin doses with recommended guidelines and health records demonstrated discrepancies for a subset of participants. First, the reported daily energy intake shown in Figure 3A (participants are ordered by age) varied considerably between participants from 55.2 kcal/day to 4766 kcal/day. The mean energy intake (excluding outliers below 1000 kcal/day) was 1796 ± 563 kcal/day for men and 1484 ± 356 kcal/day for women. For reference, dietary reference values recommend 1860 and 2290 kcal/day for, respectively, moderately active females and males between the ages of 60 and 69 years.20 Thus, the reported energy intake was lower than reference values. Age did not appear to be a limiting factor for dietary intake logging, as mean reported daily energy intake was not correlated with year of birth (Spearman’s ρ = −0.19, P = 0.15). A complete breakdown of macronutrient intake (carbohydrates, sugars, saturated and unsaturated fat, protein, fiber, and salt) is provided in Supplementary Fig. S4.
FIG. 3. Assessment of reported data quality. (A) Boxplots of the daily energy intake (kcal/day) reported from day two (day one excluded due to the variability of the times of day at inclusion) until visit 2 for each participant. Participants are colored by sex (gray = male, black = female, outliers are colored red) and sorted by year of birth (ascending from left to right). Mean daily energy intake per sex (including outliers) is depicted by corresponding dashed lines (1655 kcal/day for males and 1259 kcal/day for females). (B) Number of moods reported at each hour of the day (angry = dark red, happy = dark green, relaxed = light green, sad = dark blue, stressed = light red). Underneath the figure, the wearing percentage at each nudge time (08:00, 12:00, 18:00, and 20:00) and corresponding response percentage to the nudges are given with 95% confidence intervals. (C) Bland–Altman plot (central plot), with adjacent plots showing the marginal distributions, comparing the daily participant-reported rapid-acting insulin doses with expected doses according to their health records (n = 19). Points (one per day per participant) are colored by the number of daily insulin injections for the respective participant as part of their prescribed treatment: two to three daily injections (represented by light green triangles), four injections (dark blue diamonds), and insulin pump users (light orange squares). 95% limits of agreement (dashed black lines, −43 to 14 IU/day) have been calculated using cut-off quantile estimators due to non-normal differences (Shapiro–Wilk: P < 0.05). The median bias (solid black line) was 0 IU/day. Participants with a prescribed broad daily dose range (more than ± 5 IU), who have been prescribed to inject as needed, or who did not report insulin throughout the study period have been excluded. (D) Bland–Altman plot (central plot), with adjacent plots showing the marginal distributions, comparing the daily participant-reported ultra-long, long, and intermediate-acting insulin doses with expected doses according to their health records (n = 36). 95% limits of agreement (dashed black lines, −60 to 37 IU/day) have been calculated using cut-off quantile estimators due to non-normal differences (Shapiro–Wilk: P < 0.05). The median bias (solid black line) was 0 IU/day. Points are colored similar to (C).
Second, Bland–Altman plots comparing daily (accumulated) reported insulin doses with prescriptions from health records, stratified by rapid and (ultra) long-acting insulin analogues (Fig. 3C, D), showed an overall mixed agreement between reported and prescribed values. The median bias of the rapid- and long-acting analogue doses were both 0 IU/day. The relative difference between the reported and prescribed daily dose was between −15% and 15% for 50.2% of study days for short-acting insulins (this range was defined to allow some daily variability, typical for short-acting insulin therapy). There was no difference between reported and prescribed dose on 55.5% of study days for long-acting insulins. Otherwise, daily insulin doses were mostly underreported compared with prescribed doses (31.6% and 31.0%, respectively). Note the distinct declining line of points for long-acting insulins that correspond to days without reported doses. Nonetheless, the deviations in the reported daily doses could mostly be attributed to a subset of individuals (Supplementary Figs. S5 and S6).
Ecological momentary assessment of mood with the nudging mechanism using the smartwatch provided a method to repeatedly gain insight into psychological status within the natural flow of life. Of the five mood categories, participants primarily reported being relaxed (78.9%) or happy (13.5%) throughout the day (Fig. 3B), while stressed (5.4%), sad (1.2%), and angry (1.0%) were reported less frequently. Moreover, mood was reported most frequently shortly after participants were nudged, evident by a considerably higher number of reports during the hours of the day including 08:00, 12:00, 18:00, and 20:00. Differences in the number of reports at these four times can be attributed to differences in wearing percentage and response percentage. First, the wearing percentage was lower at 52.7% (95% CI, 49.1%–56.3%) in the morning compared with 94.0% (95% CI, 92.1%–95.6%), 95.6% (95% CI, 93.9%–96.9%), and 96.1% (95% CI, 94.5%–97.3%) at 12:00, 18:00, and 20:00, respectively. Second, the nudging response percentage was considerably lower at noon with 33.0% (95% CI, 29.6%–36.6%) compared with 18:00 and 20:00 with 41.5% (95% CI, 37.9%–45.1%) and 42.1% (95% CI, 38.5%–45.7%) respectively, while the response percentage at 08:00 was 35.4% (95% CI, 30.7%–40.3%). Thus, the nudging mechanism was most effective in the evening times. These wearing and response percentages, overall and stratified by nudge time, did not decrease throughout the study period and were unaffected by the check-up call around study day five (Supplementary Figs. S7 and S8). Nevertheless, similar to the reported dietary intake and insulin doses, the response percentages varied considerably among participants, ranging from 0% to 96% during the observational period (Supplementary Fig. S9). Responsiveness to nudging was also not indicative of mood logging in general, as individuals who did not respond to nudges still reported their mood at other times.
Lastly, a comparison of measured heart rates during reported physical activity with heart rates outside of reported physical activity using a one-sided Wilcoxon rank-sum test demonstrated heart rate to be elevated during reported physical activity in 46 of 51 (90.0%) participants who reported physical activity (see Supplementary Fig. S10 for heart rates during and outside of periods of reported physical activity).

Lifestyle and glycemic excursions

Evaluation of logged entries preceding, and therefore potentially associating with, peaks in the CGM signal demonstrated different proportions of logged entries in the 2 hours before a peak than in the 2.5–4.5 hours (control window) before that peak for multiple lifestyle variables, as shown in Figure 4D. The proportion of peaks in the CGM signal preceded by dietary intake was higher in the test window (median of 58.6%, 63.4%, and 62.7% respectively) compared with the control window (median of 32.5%, 32.7%, and 38.0% respectively) for people with type 1 diabetes (n = 8), insulin-naïve type 2 diabetes (n = 12), and insulin-dependent type 2 diabetes (n = 36). These differences were significant for both type 2 diabetes groups (P = 8.4 × 10⁻⁵ (<0.0042) and P = 9.4 × 10⁻⁵) but not for the type 1 diabetes group (P = 0.0145). Analysis of insulin dosing demonstrated a similar trend with higher proportions in the test windows (53.5% and 11.0%) compared with the control windows (20.5% and 4.5%) for the type 1 diabetes and insulin-dependent type 2 diabetes groups, with none of the differences being significant (P = 0.0151 and P = 0.0498). Supplementary Figure S11 demonstrates insulin dosing, within both windows, occurred rarely without reported meal intake. The difference in proportions of logged entries between test (1.5%, 0.0%, and 0.0%) and control (0.0%, 0.0%, and 0.0%) windows are considerably smaller for negative moods (stressed, angry, and sad) and similarly for logged physical activity (15.6%, 5.2%, and 5.2%, respectively, versus 14.3%, 5.6%, and 9.0%).
FIG. 4. Association between glycemic excursions and logged data. (A) Ambulatory glucose profile (AGP) of a single participant during the study (median by time of day is represented by the solid blue line, the dark blue area is enclosed by the 25th and 75th percentile, while the light blue area is enclosed by the 5th and 95th percentile) with time in each glucose range (dark orange: >13.9 mmol/L, light orange: 10.0–13.9 mmol/L, green: 3.9–10.0 mmol/L, red: 3.0–3.9 mmol/L, dark red: <3.0 mmol/L) and associated number of logged reports per lifestyle variable at each time of day (blue: physical activity, light green: negative (stressed, sad, or angry) mood, dark green: insulin dosing, red: meals) (B, C) Filtered CGM signal for 1 day, with logged lifestyle events in the subplots below, with 2-hour test windows (in red) preceding a detected peak and the 2-hour control windows (in gray). (D) Proportion of test (black) and control (gray) windows including a logged entry (meals, insulin dosing, negative mood, or physical activity) by diabetes type and insulin therapy (type 1 diabetes, insulin-naïve type 2 diabetes, and insulin-dependent type 2 diabetes). Cases where the proportions are significantly higher in the test windows compared with the control window according to a one-sided Wilcoxon rank-sum test with Bonferroni correction are depicted with an asterisk symbol (*). (E) Odds ratios (ORs) and 98.3% confidence intervals (CIs) of the association between lifestyle factors and CGM peak occurrence for the three subgroups. Estimates were obtained from mixed-effects logistic regression models including all lifestyle variables simultaneously and a participant-level random intercept to account for repeated measurements within individuals.
To assess the independent association of the occurrence of CGM peaks with prior reported lifestyle variables at a subgroup-level, mixed-effects logistic regression analyses were used to account for the repeated measurements design and time-invariant participant characteristics (results are shown in Fig. 4E). After mutual adjustment for all lifestyle variables, odds were significantly higher for meals to be reported prior to a CGM peak for all subgroups (type 1 diabetes OR: 2.9 [98.3% CI: 1.5–5.7], insulin-naïve type 2 diabetes OR: 3.9 [98.3% CI: 2.5–6.2], and insulin-dependent type 2 diabetes OR: 2.5 [98.3% CI: 1.8–3.4]). Similarly, odds were significantly higher for insulin dosing reports prior to peaks in the CGM signal for insulin users (type 1 diabetes OR: 3.2 [98.3% CI: 1.6–6.3] and insulin-dependent type 2 diabetes OR: 2.6 [98.3% CI: 1.7–3.9]). No significant associations were found with negative mood and physical activity (see Fig. 4E; all CIs include OR = 1).

Discussion

The DiaGame study extends prior work on glucose and lifestyle monitoring by demonstrating that consumer-grade wearable devices and applications, supported by a nudging mechanism, can be used to capture multimodal real-world data on glycemic dynamics alongside lifestyle factors. By integrating these diverse data streams, we illustrate how these everyday behaviors relate to spikes in blood glucose levels in people with type 1 diabetes, insulin-naïve type 2 diabetes, and insulin-dependent type 2 diabetes.
Our study showcased the opportunity to harness wearable devices as a feasible method of multimodal longitudinal data collection under real-world conditions in individuals. These devices required minimal calibration steps, could be operated by participants following a short instruction session, and no major problems were identified by the research team (except for two CGM sensor failures) or reported by participants. Moreover, the interaction of the participants with the applications was effective, reflected by the high percentage of participants providing self-reported information. In addition, the use of a blinded CGM negated the need to scan every 8 hours, potentially leading to loss of data and avoiding influencing the participant’s decision-making. The commercial availability of these consumer-grade devices and public access to the applications allow for time-effectiveness and easy scalability to large cohorts. Thereby, providing the means to obtain continuous insight into lifestyle and personalized glycemic dynamics to the public and, optionally, their health care providers.
The combination of a CGM, a smartwatch, and a smartphone application provided insight into the daily life of an individual, from the comfort of their home, of which limited information was otherwise available. However, data collected under free-living conditions are usually not a comprehensive description of all lifestyle events. Evaluation of data quality indeed indicated that participant-reported data did not always compare with expectations, with heterogeneity in the magnitude of these differences between participants. First, the energy intake reported through the smartphone application was, on average, approximately 450 kcal/day lower than expected when compared with the European reference values for moderately active women and men aged 60–69 years.20 This discrepancy may reflect known challenges in dietary self-reporting, including conscious or unconscious underreporting, particularly in studies focusing on lifestyle behavior. Importantly, however, the mean reported energy intake in the present cohort was comparable with that reported in a younger population without diabetes using the same smartphone application (1830 kcal/day, SD 485 kcal/day, n = 100), in which the application was shown to provide estimates comparable with 24-hour dietary recalls. Another study that relied on picture-based food annotations by a dietitian reported comparable daily energy intakes (1672 kcal/day, SD 1038 kcal/day, n = 8).13,21 In addition, mean daily carbohydrate intake was consistent with participant-reported values in people with type 1 diabetes.12 Collectively, these comparisons suggest that, despite lower-than-expected absolute energy intake relative to dietary guidelines, the reported intake is in line with values obtained using other approaches in free-living settings. Furthermore, all participants reported dietary intake for at least 11 days, and participant age did not appear to be a limiting factor in reporting dietary intake using a smartphone application, even in this generally older cohort, typical of type 2 diabetes. Thus, even though energy intake may deliberately be reduced or underreported, partially accounting for the discrepancy, accurate dietary intake assessment in free-living conditions remains challenging.
Second, the smartwatch offered an easily accessible means for insulin usage registration, which needed no connection to the internet or a smartphone and was always at hand for participants. These reported insulin doses were accurate on most of the study days, when they could be compared with prescribed insulin treatments. These comparisons demonstrated that only 5 out of 36 long-acting insulin users, and no short-acting insulin users, failed to report at least 1 day for which the accumulated daily insulin dosages were comparable with their health records. However, the accumulated daily insulin dosages derived from insulin reports were frequently lower than prescribed (especially evident when one dose a day was prescribed, and none were reported). It is unclear why insulin administration was underreported. While daily dose adjustments are inherently part of the short-acting insulin treatment, the quality of reported data on insulin use may be affected by the otherwise repeated nature of daily insulin dosing, leading to a lack of urgency to consistently report these events. It has already been shown that data on insulin dosing can be effectively collected from insulin pumps,22 which are predominantly used by people with type 1 diabetes, whereas the recent development of smart insulin pens could potentially alleviate the burden of insulin dose registration altogether.
Third, ecological momentary assessment of mood using the smartwatch, supplemented with a nudging mechanism four times a day, was an effective method to collect information on the perceived mood of participants. Participant involvement was consistent throughout the study period with high wearing percentages (except in the early morning when several participants may not yet have woken up) and overall steady response percentages. Participants for whom the nudging mechanism was less effective still provided ample mood reports without this nudging encouragement. Nonetheless, participants predominantly reported non-negative (happy or relaxed) moods, which could be valid but could also indicate participants were biased to report socially desirable behavior by using the nudging system. In addition to providing a means to report mood and insulin doses, the smartwatch enabled the measurement of heart rate, acceleration, and step count to independently inform on physical activity (next to participant-reported physical activity, during which heart rate was shown to be elevated). These measurements may supplement registration of physical activity, since the number of days with self-reported physical activity was inconsistent across individuals. Lastly, the mean daily value of none of the variables reported by the participants decreased considerably throughout the study period, which, if this had happened, could have suggested that the data collection protocol may have placed too much of a burden on the participants. Thus, while the collected data may not be a complete description of all daily events, these wearable devices can effectively be used to acquire multimodal real-world data. Hereby answering the call for precision monitoring methods as the next step toward precision prevention, diagnostics, and prognostics.1,2
The acquired data can subsequently be harnessed to assess the association of lifestyle variables with glycemic dynamics, such as peaks in the CGM signal, at an individual level. We have been able to show that peaks in the CGM signal are independently associated with reported meal intake and insulin dosing, demonstrated by higher within-individual proportions of these lifestyle events prior to peaks and by higher ORs for glucose peaks at a subgroup-level, accounting for repeated measurements and time-invariant participant characteristics. The observed association between glycemic excursions and dietary intake is in line with previous research reporting a similar association between dietary intake and CGM peaks in adults without diabetes.23 Negative mood and physical activity, which have not previously been reported to result in acute glycemic excursions (except for high-intensity exercise), were not associated with peaks in the CGM signal at an individual or subgroup level. Importantly, we cannot exclude that the demonstrated underreporting of data could have affected the estimated associations. However, unless underreporting systematically differs between peak and control windows, this misclassification is expected to bias effect estimates toward the null hypothesis rather than generate spurious associations. Therefore, the reported associations are likely conservative estimates of the true underlying relationships. Furthermore, the within-individual study design mitigates between-person reporting differences, as each participant serves as their own control. Future studies incorporating more structured and comprehensive assessments of lifestyle behaviors may further clarify how these factors shape glycemic dynamics at the individual level.
We acknowledge that the study cohort consisting of known patients does not provide a complete cross-sectional overview of the diabetic population in the Netherlands due to selection from the region and restriction to Dutch-speaking individuals. Nonetheless, the study cohort is typical for a type 1 and 2 diabetes cohort when compared with other studies in terms of patient characteristics. Inclusion may be biased for participants with at least some affinity for digital devices, as those unfamiliar or hesitant to use wearable devices may be more likely to refuse participation. These latter people may need additional support to promote adequate use of these wearable devices.
Multiple enhancements could further enrich the collected data through the inclusion of standardized at-home meals and meal tolerance tests,23 while automated data capturing systems (e.g., insulin pumps and smart insulin pens to register insulin dosing) could potentially improve the quality of the data and reduce the burden on participants. Furthermore, the registration of medication usage can be extended from the use of solely exogenous insulin to oral medications (e.g., metformin and GLP-1 agonists). Adherence to these medications was currently assumed to be consistent throughout the study period, even though in practice adherence has been shown to be inconsistent.24 In addition, real-time communication between devices can enable personalized nudging mechanisms, by incorporating information from all devices, for Just-In-Time Adaptive Interventions.25 Tailoring the timing, frequency, and format of the nudging to the individual may improve effectiveness, while just-in-time nudging could be used to promote reports on dietary intake or insulin injections when blood glucose excursions are observed (currently the nudging mechanism was limited to data collection on mood due to the inherent continuity of human mood, which is lacking in all other variables). Overall, the study protocol, with or without these enhancements, can be used in future studies with prolonged study periods to elucidate long-term behavioral patterns and seasonal variability.
The data collected in real-world conditions hold the potential for various clinical purposes, as indicated by the growing interest and recent increase in research within this field. First, it offers a deeper understanding of intra-day and inter-day glycemic variability at an individual level. This understanding enables health care providers to deliver targeted and personalized care (precision medicine), which may contribute to improved health outcomes (e.g., to deliver app-based personalized lifestyle recommendations15). Second and more importantly, the collected data offer valuable insights when analyzed across broader groups. It can reveal interindividual variations, facilitating the identification of distinct subgroups within the diabetes population and unveiling their distinct characteristics and needs (e.g., to stratify meal events for digital phenotyping16). Lastly, these data can support the development of next-generation simulators and digital twins, personalized dynamic metabolic models capable of predicting glucose levels and their modulation due to daily activities.26 Such models have the potential to serve multiple purposes, from enhancing broader group-level education by showcasing the response of blood glucose levels to lifestyle decisions to in silico experiments with virtual patient cohorts. A deeper understanding of a disease like diabetes and the various factors influencing blood glucose levels can foster increased self-confidence and effective self-management in people with diabetes. Given that improved self-management in diabetes correlates with better health and reduced short- and long-term complications, the significance of this understanding is clear.27 Furthermore, diabetes self-management education and support currently occur predominantly through one-on-one consultations with health care providers. However, with the escalating numbers of patients with diabetes globally, there is a growing need for more scalable, sustainable, and affordable support. Electronic resources and digital interventions, such as advanced simulators predicting glucose levels at a personal level, could offer a crucial addition to future health care. They hold the potential to make health care more efficient and accessible while simultaneously improving its quality.

Conclusions

The DiaGame study demonstrates that consumer-grade wearable devices, combined with applications and nudging, offer a feasible and effective means for large-scale multimodal real-world data collection in people with diabetes, with potential applicability to broader populations. At the same time, successful implementation of these approaches relies on careful consideration of individual digital literacy and robust safeguards for data privacy. The real-world data obtained enabled us to assess lifestyle factors and their associations with glycemic excursions, particularly highlighting the roles of dietary intake and insulin use. Such approaches may ultimately pave the way toward more individualized care, support long-term monitoring of disease progression, and inform the development of personalized treatment strategies and self-management tools.

Authors’ Contributions

R.d.V. was responsible for conceptualization, methodology, software, validation, formal analysis, investigation, resources, data curation, visualization, and writing the first draft of the article. E.F.H.R. was responsible for conceptualization, methodology, validation, investigation, resources, and writing the first draft of the article. D.F.D.C. worked on conceptualization, methodology, software, validation, investigation, resources, and data curation. E.M.W.L.C.-V.d.M. was responsible for conceptualization, methodology, validation, investigation, and resources. P.M.E.v.G., P.C.M.W.-v.P., U.K., P.A.J.H., N.A.W.v.R., and H.R.H. contributed to conceptualization, methodology, and reviewing of the article. In addition, N.A.W.v.R. and H.R.H. provided supervision and acquired funding, while N.A.W.v.R. was also responsible for project administration. All authors approved the definitive version of the article.

Acknowledgments

An earlier version of this article was made available as a preprint on medRxiv (https://www.medrxiv.org/).28

Author Disclosure Statement

H.H. was a shareholder and on the board of directors of HRH Diabetes Games B.V. at the time this work was conducted. All other authors declare no conflict of interest.

Funding Information

This research is part of the DiaGame project funded by NWO Data2Person (628.011.027).

Data availability statement

The data used and/or analyzed in the current study are available from the corresponding author upon reasonable request.

References

1. Chung WK, Erion K, Florez JC, et al. Precision medicine in diabetes: A consensus report from the American Diabetes Association (ADA) and the European Association for the Study of Diabetes (EASD). Diabetes Care, 2020; 43(7):1617–1635;
2. Hermanns N, Ehrmann D, Shapira A, et al. Coordination of glucose monitoring, self-care behaviour and mental health: Achieving precision monitoring in diabetes. Diabetologia, 2022; 65(11):1883–1894;
3. American Diabetes Association. Pharmacologic approaches to glycemic treatment: Standards of medical care in diabetes-2021. Diabetes Care, 2021; 44(Suppl 1):S111–S124;
4. Colberg SR, Sigal RJ, Yardley JE, et al. Physical activity/exercise and diabetes: A position statement of the American Diabetes Association. Diabetes Care, 2016; 39(11):2065–2079;
5. Evert AB, Dennison M, Gardner CD, et al. Nutrition therapy for adults with diabetes or prediabetes: A consensus report. Diabetes Care, 2019; 42(5):731–754;
6. O’Hearn M, Lara-Castor L, Cudhea F, et al. Incident type 2 diabetes attributable to suboptimal diet in 184 countries. Nat Med, 2023; 29(4):982–995;
7. Young-Hyman D, De Groot M, Hill-Briggs F, et al. Psychosocial care for people with diabetes: A position statement of the American Diabetes Association. Diabetes Care, 2016; 39(12):2126–2140;
8. Miller EM. Using continuous glucose monitoring in clinical practice. Clin Diabetes, 2020; 38(5):429–438;
9. Pendergast FJ, Ridgers ND, Worsley A, et al. Evaluation of a smartphone food diary application using objectively measured energy expenditure. Int J Behav Nutr Phys Act, 2017; 14(1):30;
10. Rodriguez-León C, Villalonga C, Munoz-Torres M, et al. Mobile and wearable technology for the monitoring of diabetes-related parameters: Systematic review. JMIR Mhealth Uhealth, 2021; 9(6):e25138;
11. Riddell MC, Li Z, Gal RL, et al.; T1DEXI Study Group. Examining the acute glycemic effects of different types of structured exercise sessions in type 1 diabetes in a real-world setting: The type 1 diabetes and exercise initiative (T1DEXI). Diabetes Care, 2023; 46(4):704–713;
12. Marling C, Bunescu R. The OhioT1DM dataset for blood glucose level prediction: Update 2020. In: CEUR Workshop Proc, 2020; 2675:71–74.
13. Dubosson F, Ranvier JE, Bromuri S, et al. The open D1NAMO dataset: A multi-modal dataset for research on non-invasive type 1 diabetes management. Inform Med Unlocked, 2018; 13:92–100;
14. Zhao Q, Zhu J, Shen X, et al. Chinese diabetes datasets for data-driven machine learning. Sci Data, 2023; 10(1):35;
15. Zahedani AD, Veluvali A, McLaughlin T, et al. Digital health application integrating wearable data and behavioral patterns improves metabolic health. NPJ Digit Med, 2023; 6(1):216;
16. Pai A, Santiago R, Glantz N, et al. Multimodal digital phenotyping of diet, physical activity, and glycemia in Hispanic/Latino adults with or at risk of type 2 diabetes. NPJ Digit Med, 2024; 7(1):7;
17. Voedingscentrum. Mijn Eetmeter. Available from: https://mijn.voedingscentrum.nl/nl/eetmeter/. 2023.
18. Dutch National Institute for Public Health and the Environment. Nederlandse Voedingsmiddelen Informatie Portaal. 2024.
19. The MathWorks Inc. Matlab Version: 24.1.0.2537033 (R2024a). 2024.
20. EFSA (European Food Safety Authority). Dietary Reference Values for nutrients. Summary report. EFSA Supporting Publications, 2017; 14(12);
21. Ocké M, Dinnissen C, Stafleu A, et al. Relative validity of MijnEetmeter: A food diary app for self-monitoring of dietary intake. Nutrients, 2021; 13(4):1135;
22. Prioleau T, Bartolome A, Comi R, et al. DiaTrend: A dataset from advanced diabetes technology to enable development of novel analytic solutions. Sci Data, 2023; 10(1):556;
23. Héritier H, Allémann C, Balakiriev O, et al. Food & You: A digital cohort on personalized nutrition. PLOS Digit Health, 2023; 2(11):e0000389;
24. Kirkman MS, Rowan-Martin MT, Levin R, et al. Determinants of adherence to diabetes medications: Findings from a large pharmacy claims database. Diabetes Care, 2015; 38(4):604–609;
25. Spruijt-Metz D, Wen CKF, O’Reilly G, et al. Innovations in the use of interactive technology to support weight management. Curr Obes Rep, 2015; 4(4):510–519;
26. Katsoulakis E, Wang Q, Wu H, et al. Digital twins for health: A scoping review. NPJ Digit Med, 2024; 7(1):77;
27. Davis J, Fischl AH, Beck J, et al. 2022 National standards for diabetes self-management education and support. Diabetes Care, 2022; 45(2):484–494;
28. de Vries R, Reinders EFH, de Carvalho DF, et al. The DiaGame study: Multimodal data collection in free-living conditions using consumer-level wearable devices and apps in people with diabetes. medRxiv, 2024;
Cite this article as: de Vries R, Reinders EFH, Ferreira de Carvalho D, Cruts - Van de Meulengraaf EMWL, Van Gorp PME, Wouters-van Poppel PCM, Kaymak U, Hilbers PAJ, van Riel NAW, and Haak HR. (2026) Real-world association of lifestyle reported using wearable devices with glycemic excursions in people with diabetes: the DiaGame study, Diabetes Technology and Obesity Medicine 2:1, 46–59, DOI: 10.1177/29986702261416447.

Supplementary Material

Please find the following supplemental material available below.

For Open Access articles published under a Creative Commons License, all supplemental material carries the same license as the article it is associated with.

For non-Open Access articles published, all supplemental material carries a non-exclusive license, and permission requests for re-use of supplemental material or any part of supplemental material shall be sent directly to the copyright owner as specified in the copyright notice associated with the article.