Intended for healthcare professionals
Open access
Research article
First published online April 8, 2026

Cultural Relevance at Scale: The Effects of an Ethnic Studies Expansion on Academic Outcomes

Abstract

Ethnic studies is a culturally relevant curriculum designed to address the instructional needs of an increasingly diverse student population. However, evidence regarding the effectiveness of this curriculum at scale remains limited. This study evaluated the impact of districtwide implementation using a student-level difference-in-differences design with two-way fixed effects. We found that enrollment increased overall grade-point average by 0.17 points (0.24 SD), with the largest gains observed in math and science, and reduced course failure by 5.6 percentage points (0.14 SD). These benefits extended to all student groups, with stronger effects among academically vulnerable, male, Black and Latinx students and those with individualized education plans. Our findings suggest that well-implemented ethnic studies can be scaled effectively and can potentially reduce disparities in student outcomes.

Introduction

For decades, researchers have documented persistent racial and ethnic gaps in student outcomes and unequal access to quality education (Coleman, 1966; Matheny et al., 2023). Despite numerous K–12 reforms, evidence of their effectiveness in improving outcomes for historically marginalized students remains mixed (Bleiberg et al., 2024; Dee & Jacob, 2011; Ladd, 2017). Scholars have long emphasized the need for culturally relevant approaches that draw on the strengths of increasingly diverse communities while addressing students’ instructional and pedagogical needs (Ladson-Billings & Tate, 1995; Yosso, 2005). More recently, Polikoff (2021) argued that high-quality curricula reflecting students’ cultural backgrounds are essential for promoting both equity and excellence in education. Ethnic studies (ES) has emerged as a prominent example of these values, offering curricula rooted in the experiences of students of color and increasingly used to promote educational equity (Tintiangco-Cubales et al., 2015). Although ES originated in higher education during the social movements of the 1960s, its presence in K–12 schools was limited, until recently, to local initiatives.
In recent years, ES has expanded beyond localized efforts as districts and states have formally adopted policies mandating its implementation—often amid significant political debate and resistance. Notably, California became the first state to require ES for high school graduation, beginning with the class of 2030, and several other states and districts have followed suit. By 2020, nearly half of California high school students were enrolled in schools offering ES (Kwon, 2021; Penner & Ma, 2024). Yet opposition to ES, which has existed since its origins in the 1960s, continues today, as seen in Arizona's Mexican American Studies (MAS) ban in 2010, and more recent restrictive policies highlight continuing controversy (Kocivar, 2024; Medina, 2017). Even in California, the future of the graduation requirement remains uncertain because its most recent state budget did not allocate funding for implementation (Jones, 2025). These developments highlight both the opportunities and challenges associated with the institutionalization of ES.
The growing prevalence of ES coursework raises important questions about its effects when implemented at scale. Although recent studies have highlighted the potential of ES to improve student outcomes—including course performance, graduation rates, and college enrollment (Bonilla et al., 2021; Cabrera et al, 2014; Dee & Penner, 2017)—existing research is limited in scope. For example, Cabrera et al. (2014) provided largely descriptive findings of Tucson's MAS Program, whereas causal studies have focused on a small-scale ES pilot targeting academically struggling students in the San Francisco Unified School District (Bonilla et al., 2021; Dee & Penner, 2017). This raises concerns about the generalizability of the benefits of ES to broader and more diverse student populations. Moreover, the scaling of promising education interventions frequently leads to diminished effectiveness (Al-Ubaydli et al., 2020; Jepsen & Rivkin, 2009; Kraft et al., 2024; von Hippel & Wagner, 2018). As ES becomes a core element of high school curricula in California and elsewhere, rigorous evaluation of its impact at scale is essential for understanding its potential to improve academic trajectories for all students.
We provide the first causal evidence on the academic impacts of a districtwide expansion of high school ES in the San Francisco Unified School District (SFUSD). Using longitudinal student-level data for 10 cohorts followed from grades 6 through 12, we estimated the effects of ES enrollment on overall grade-point average (GPA) and course failure. Our empirical strategy employed a student-level two-way fixed-effects model to compare students’ course performance before and after ES participation. We further used an event-study framework to assess the dynamic effects of ES enrollment over time and a synthetic difference-in-differences (SDID) approach to adjust for preexisting differences between students who did and did not enroll in ES.
We found that ES enrollment improved academic outcomes, increasing GPA by 0.17 points (0.24 SD) and reducing course failures by 5.6 percentage points (0.14 SD). These effects translated into a roughly 15% increase in students meeting the 3.0 GPA threshold for University of California admission and a 27% reduction in course failures, with gains especially pronounced in math and science. ES benefits students across all racial and ethnic groups, with particularly strong effects for lower-performing students, male students, Black and Latinx students, and students receiving special education services. Importantly, these effect sizes fell within the medium to large range for educational interventions and were both rare and substantively meaningful, because average effects in education research typically fall below 0.10 SD (Kraft, 2020). Results remained robust across model specifications, sensitivity checks for differential attrition, sample restrictions, and falsification tests, underscoring the credibility of these causal estimates.
This study makes three key contributions to the existing literature. First, it provides novel causal evidence on successfully scaling a promising curricular intervention districtwide, extending prior research that focused primarily on a smaller, well-resourced pilot program (Bonilla et al., 2021; Dee & Penner, 2017). Second, it broadens the evidence base regarding the effectiveness of ES across diverse student populations, including variation by academic preparedness, race and ethnicity, special education participation, and English language proficiency. Finally, it contributes to research on high school transitions by demonstrating how a race-conscious course can buffer students against the adverse effects of transitioning to high school during adolescence (Benner & Graham, 2009; Seidman et al., 1996).

Theoretical Framework

ES is a curricular and pedagogical approach that centers the histories, cultures, and experiential aspects of diverse communities in the classroom. Drawing on principles of culturally relevant pedagogy (Ladson-Billings, 1995), ES affirms student identities, promotes academic engagement through relevant content, and cultivates critical consciousness by enabling students to examine and challenge structural inequality. The curriculum fosters individual and collective agency by examining colonialism, racism, and power structures in the context of social movements (Reyes-McGovern & Buenavista, 2016; Sleeter & Zavala, 2020). By connecting academic learning to real-world civic involvement, ES fosters both individual empowerment and community action (Reyes-McGovern & Buenavista, 2016; Tintiangco-Cubales et al., 2015).
ES emerges from critical traditions, including critical race theory, Latina/o/x critical race theory, critical race structuralism, and other critical traditions, which emphasize how race, racism, and intersecting oppressions shape educational institutions and access to opportunity (Bell, 1995; Bernal, 2002; Delgado & Stefancic, 2001; Ladson-Billings & Tate, 1995; Solórzano & Yosso, 2002). These perspectives highlight how curricular omissions, race-evasive practices, and deficit-based narratives marginalize students from nondominant groups while advancing education as a means of social transformation (Wiggan et al., 2023). Rooted in student and community activism, ES was designed from its inception to reconstruct the histories of marginalized groups, centering their contributions to U.S. society as means of establishing democratic pluralism and achieving educational equity (Hu-DeHart, 1993).
ES is particularly well suited to engage students during the transition to high school—a period of rapid developmental change characterized by identity formation, heightened social awareness, and emerging civic orientation. Psychosocial and social identity theories show that identity development accelerates during this period as students encounter new academic and social challenges during their entry into high school (Benner & Graham, 2009; Lee & Smith, 2001). This transition often includes risks such as increased rates of grade retention (Pharris-Ciurej et al., 2012), declining achievement (Rice, 2001), heightened loneliness, and diminished self-esteem (Barber & Olsen, 2004; Benner & Graham, 2009; Eccles & Roeser, 2011). Racially minoritized students may also face bias and discrimination that further shape their school engagement and experiences (Benner et al., 2018; Eccles et al., 2006).
Given these risks, scholars have emphasized that peer connection, sense of belonging, and positive teacher relationships are crucial protective factors for students’ well-being (Barber & Olsen, 2004; Benner, 2011; Weiss & Bearman, 2007). ES courses explicitly teach students the conceptual language and foster critical thinking skills to analyze inequality, examine social movements, and connect their identities to wider social issues. Introducing this content in early high school—when students are developmentally primed to question societal norms and consider their role in shaping them—may catalyze meaningful increases in academic engagement and motivation.
Multiple theoretical traditions have suggested pathways through which ES can improve academic outcomes for historically marginalized students. Our framework drew from culturally relevant pedagogy, ethnic-racial identity development, critical consciousness, and social psychological mindsets. ES mirrors the tenets of culturally relevant pedagogy and culturally responsive or sustaining teaching, which aim to support diverse learners by prioritizing academic development, affirming students’ cultural and racial identities, and cultivating critical thinking about social issues and inequities (Gay, 2010; Ladson-Billings, 1994, 1995; Paris & Alim, 2017). ES curricula expand on these principles through deeper reflection and social action (Cuauhtin, 2019), with the aim of unlocking the educational potential of marginalized students by centering their often-overlooked cultural knowledge, skills, and assets (Yosso, 2005).
ES also offers students a meaningful context for developing a positive ethnic-racial identity (ERI), a process of exploring and constructing the significance, centrality, and emotional meaning of group membership (Gillespie et al., 2025; Rivas-Drake et al., 2014; Umaña-Taylor et al., 2014). ERI is shaped by heritage, lived experiences, and broader sociohistorical contexts, reflecting the extent to which students affirm its personal significance in their lives (Umaña-Taylor, 2023). For youth of color navigating stereotypes, cultural differences, and identity-based tensions, a secure and positive ERI is linked to healthier adjustment and smoother transitions to adulthood (Eccles et al., 2006; Phinney & Kohatsu, 1999; Rivas-Drake et al., 2014). Research has shown that interventions focused on ERI development foster psychosocial well-being and academic engagement in adolescents (Umaña-Taylor, 2023). In line with this, ES courses often invite students to reflect on their racial and cultural identities, consider their intersections with other aspects of self, and critically examine how they shape personal experiences and societal perceptions (Gillespie et al., 2025). Positive ERI development, in turn, may foster students’ sense of belonging, motivation, and purpose in school, thereby contributing to academic success.
Another central aim of ES is to develop students’critical consciousness, defined as an awareness of structural inequality, the ability to reflect on its causes and consequences, and a belief in one's capacity to affect social change (Diemer et al., 2016; Freire, 2014; Pinedo et al., 2025). Adolescence is considered a critical period for this development because it coincides with other key developmental processes (Pinedo et al., 2024). ES courses create opportunities for students to examine historical and contemporary injustices, connect personal and community experiences, and learn about civic and political actions that can promote social change. Research has suggested that cultivating sociopolitical efficacy and the skills to engage in activism supports reciprocal youth-context interactions and is linked to positive outcomes such as higher SAT scores, better GPAs, and increased intentions to vote (Heberle et al., 2020; Seider & Graves, 2020).
Developing critical consciousness promotes a range of positive outcomes across diverse groups. For students from marginalized communities, it strengthens academic engagement and promotes resilience in the face of discrimination (Diemer & Li, 2011; Seider & Graves, 2020). For students from more privileged backgrounds, critically examining inequality can reduce bias, build solidarity, and increase support for social change (Glasford & Johnston, 2018; Hughes et al., 2007; Nelsen, 2021). Together, the literature has suggested that critical consciousness may serve as a key psychological mechanism through which ES builds inclusive, civically-oriented learning environments (Diemer et al., 2016; Pinedo et al., 2025).
ES also incorporates key active ingredients of mindset and social psychological interventions that enhance students’ self-perception and learning capabilities. The course provides repeated opportunities to affirm their personal values, promote social belonging, cultivate a growth mindset, provide forewarning about stereotypes, and develop external attributions for challenges (Cohen et al., 2006; Walton & Cohen, 2011; Yeager et al., 2019). Whereas mindset interventions typically offer these supports for students in isolated instances, ES sustains them throughout the duration of the course, often an entire year.

Evidence on ES and Student Outcomes

A growing body of research has highlighted the social, behavioral, and academic benefits of ES for K–12 students (Bonilla et al., 2021; Cabrera et al., 2014; de los Ríos, 2013; Dee & Penner, 2017; Gillespie et al., 2024, 2025; Sleeter, 2011; Sleeter & Zavala, 2020). Qualitative and case study research has suggested that students enrolled in ES courses demonstrate increased school connectedness, motivation, ethnic identity, sense of empowerment, self-concept, critical thinking skills, and academic achievement (Halagao, 2012; Lewis et al., 2006, 2012; Thomas et al., 2008; Vasquez, 2005; Wiggan & Watson-Vandiver, 2019).
Larger-scale quantitative studies have explored the relationship between ES enrollment and student outcomes. For example, Cabrera et al. (2014) found that enrolling in the Tucson Mexican American Studies Program was associated with increases in graduation rates among four cohorts of students who elected to take the course. Quasi-experimental evidence from SFUSD's pilot ES program in a subset of district high schools indicated that students with an eighth grade GPA below 2.0 who were encouraged to take the course experienced increased cumulative ninth grade GPA, attendance, and course credits (Dee & Penner, 2017). Furthermore, these benefits extended throughout and beyond high school because these students were more likely to graduate and enroll in postsecondary education (Bonilla et al., 2021). However, it is unclear whether the effects would persist in different schools, when taught by different teachers, or with higher-performing students.

Challenges of Scale-Up

Many initially promising educational interventions fail to scale successfully (Domina et al., 2015; Elmore, 2016; Jepsen & Rivkin, 2009; List et al., 2021). Maintaining effective practices becomes challenging when programs are replicated in new conditions that alter implementation depth, sustainability, spread, and ownership (Coburn, 2003; Peurach & Glazer, 2012). Additionally, treatment effects observed in small-scale programs may not accurately reflect outcomes when expanded to broader populations or different contexts or taught by new educators (Al-Ubaydli et al., 2020). If districtwide expansion fails to preserve the core components that made initial implementations successful, lacks adequate support for new ES teachers, or involves students who are unrepresentative of the broader population, the program may not yield similar results. Therefore, assessing the effectiveness of ES at scale and its impact across diverse demographic, instructional, and school contexts is crucial to understanding its broader potential.
Our study provides novel evidence of the effects of ES implemented districtwide over more than a decade (from the 2007–08 to 2022–23 school years) and across a diverse and large group of students. We also tested the effect of ES enrollment for students across the eighth grade GPA distribution, students from different racial and ethnic backgrounds, and among students participating in special education and English language learner programs. To accomplish this, we asked the following research questions:
Research Question 1: How does ES enrollment impact students’ academic performance, specifically course grades and failure rates?
Research Question 2: Does the effect of ES enrollment vary by students’ demographic and academic characteristics?

Data

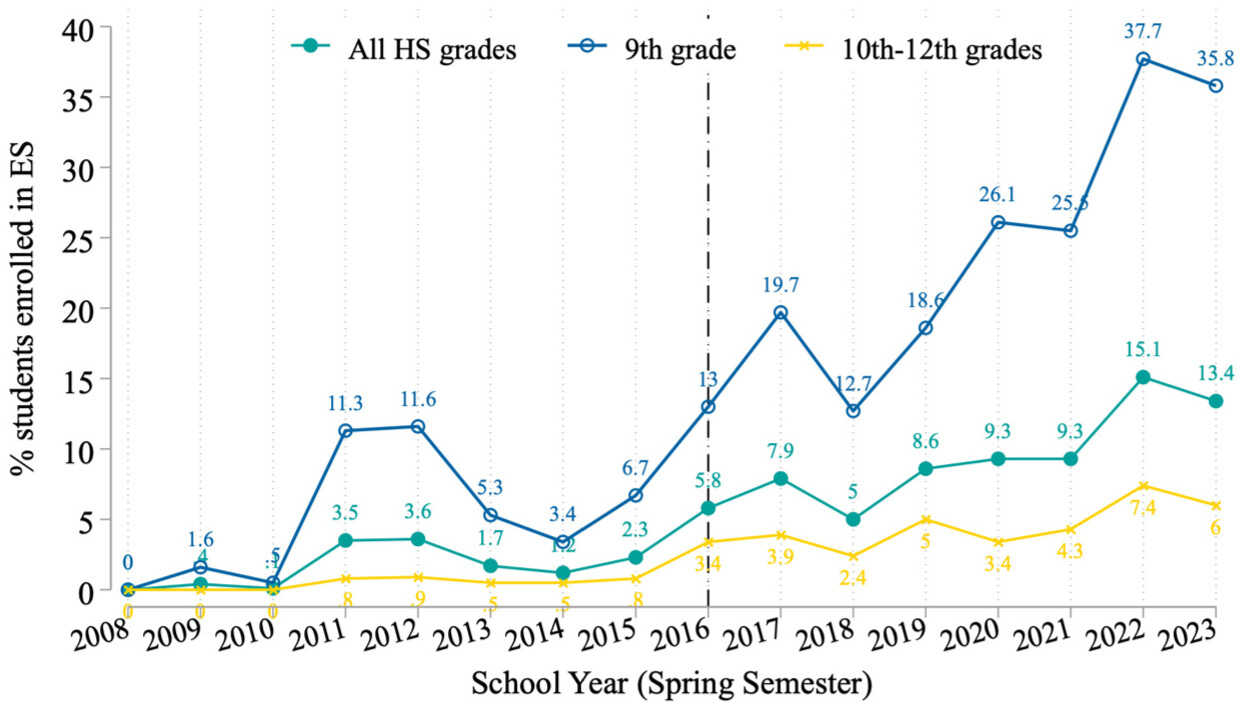
School District Context

We evaluated the districtwide implementation of high school ES in the SFUSD. This year-long district course was an early leader in establishing a formal K–12 ES program that has roots in an early community-based iteration of the program (Tintiangco-Cubales et al., 2010). The year-long district course was developed and piloted by a core group of social studies teachers over several years with support from an ES professor from a local California State University. The school board subsequently voted to expand course availability across all district high schools and then adopted a two-semester ES graduation requirement, beginning with the graduating class of 2028. However, the course was not immediately available in all schools; instead, its availability expanded gradually at different rates across schools.
Assessing the impact of scaling up ES in the SFUSD was ideal for several reasons. This program grew steadily over time, but its initial pilot was widely regarded as successful (Bonilla et al., 2021; Dee & Penner, 2017). However, many interventions that show early success face challenges when scaled to new contexts or taught by different educators (Al-Ubaydli et al., 2020; Jepsen & Rivkin, 2009; List et al., 2021). By examining the impact of ES expansion across district high schools, we document whether its success in a highly resourced pilot, driven by self-selected, motivated teachers, is sustained as new educators teach the course in diverse instructional environments.
Second, we provide credibly causal estimates of ES by leveraging rich panel data spanning 16 years, documenting its gradual expansion. Rapid expansion at the expense of local control can undermine scale-up efforts (Peurach & Glazer, 2012). The SFUSD's steady ES expansion offers a valuable opportunity to validate this approach and examine changes in program impact over time.
Finally, earlier studies were limited in examining heterogeneity across student populations due to small pilot sizes or student body composition (Bonilla et al., 2021; Cabrera et al., 2014; Dee & Penner, 2017). Our study provides critical insights into how the impact of ES varies by students’ prior academic achievement, language proficiency, special education participation, and racial or ethnic background, informing implementation efforts across California and beyond.

Data and Methods

We used student-level administrative data for students in grades 6–12 across nearly 40 middle and high schools in the SFUSD, spanning the 2007–08 through 2022–23 school years. These data included information on student course enrollments, course-level grades, identifiers for student's race/ethnicity, gender, emergent bilingual (or English language learner) status, special education program participation, grade level, and school.
We examined two key indicators of students’ academic progress as dependent variables in our analyses: student annual GPA and an indicator for whether they passed all their classes (excluding ES and physical education).1 The GPA variable was a continuous measure that took a value on a 4-point scale (4 = A; 3 = B; 2 = C; etc.). We also created an indicator for whether each student passed all their courses. The indicator took the value 1 if the student received any Ds or Fs across all graded courses. This course credit indicator specified whether a student passed all their core courses with a C– or higher (i.e., the district policy and the University of California/California State University system minimum admission requirements).
Research has suggested that high schools have responded to federal accountability standards by increasing graduation rates through grade inflation rather than real academic gains (Harris et al., 2023; Sanchez & Moore, 2022). Higher graduation rates have not been matched by improved standardized test scores (Bowden et al., 2023; Goldhaber & Goodman Young, 2024), prompting concerns that the high school diploma is being devalued (Northern et al., 2018). However, research has consistently demonstrated that high school GPA is the strongest predictor of college performance, surpassing standardized tests such as the ACT and the SAT, across a variety of contexts (Allensworth & Clark, 2020; Koretz et al., 2016; Pattison et al., 2013). Given that GPA is an imperfect measure, we conducted robustness checks to test the sensitivity of our results.
Our primary independent variable of interest was a binary indicator of student enrollment in ES, which equaled 1 for the first high school grade in which a student enrolled in ES. Because some students took ES in multiple years, we defined this variable based on their first enrollment grade. A small number of students took ES as a brief 6-week “elective wheel” during middle school.2 Sensitivity analyses excluding these students yielded qualitatively consistent results. Accordingly, for the purposes of this study, we defined ES participation as the first enrollment in an ES course during high school.

Analytic Sample

Figure 1 illustrates the growth of ES enrollment in SFUSD high schools from the 2007–08 through 2022–23 school years. Since the program's official pilot in the 2010–11 school year, enrollment in ES has quadrupled despite overall high school enrollment remaining steady at around 16,000 students per year. In the first year of the ES pilot, only 3.5% of all high school students were enrolled in ES. However, by the 2022–23 school year, enrollment had increased to 13.4%. Enrollment in ES peaked at 15% in the 2021–22 school year.
Figure 1. Proportion of high school students enrolled in ethnic studies by year.
Note. Trends in ethnic studies enrollment across school years. Sample includes all high school students who attend the SFUSD.
ES is most commonly taken in ninth grade, with nearly 36% of ninth graders enrolled in the 2022–23 school year. A smaller share—about 6%—of students took the course in grades 10–12. Most students took ES for a full academic year, whereas fewer than 0.5% enrolled for just one semester.
We constructed two analytic samples. Our main analytic sample was a balanced panel, which consisted of students observed continuously from grades 6 through 12 with complete 7-year enrollment records during our study period. It comprised 24,246 unique students—about 40% of all ninth graders during the study period in this sample—originating from 32 feeder middle schools and enrolled across 17 comprehensive and four alternative or continuation high schools, resulting in 169,722 student-year observations. Leveraging this extensive dataset, we estimated effects for 10 cohorts of sixth grade students. For comparison, we also constructed an unbalanced panel that included students who had at least 2 years of enrollment data, including the ninth grade year, and had GPA data. For students who took ES, we included those who had GPA data from at least 1 year before and at the end of the year they enrolled in ES. This expanded sample included 60,240 unique students, about 96% of all ninth graders during our study period. We used this larger sample to compare estimates from the balanced panel to ensure the robustness of our main results.
In our primary (balanced panel) sample, 19% (n = 4,615) of SFUSD high school students across 10 cohorts ever enrolled in ES (Table 1). In our unbalanced panel, 19.2% (n = 11,578) of SFUSD high school students ever enrolled during the same period (Appendix Table A1). Appendix Table A2 details the differences between the balanced and unbalanced samples. We used the balanced panel as our primary estimation sample because it allowed us to examine dynamic effects of the program on enrolled students over time.
Table 1 Baseline Descriptive Statistics, Balanced Panel
FactorOverall sampleEver enrolled in ethnic studiesNever enrolled in ethnic studies
MeanSDMeanMean
Demographics
Female0.4900.500.4860.491
Special education0.1200.330.1370.117*
Emergent bilingual0.6860.460.6640.691*
Black0.0550.230.1020.044*
Latinx0.2030.400.3510.168*
Asian0.5910.490.4100.634*
White0.0870.280.0700.091*
Other0.0640.240.0670.063
Academic performance
Grade 8 overall GPA3.2790.772.9393.359*
Grade 8 course failure rate0.2510.430.3980.216*
Grade 8 GPA <2.00.0870.280.1660.069*
Grade 8 GPA 2.0–3.00.2270.420.3240.204*
Grade 8 GPA >3.00.6860.460.5110.727*
Ethnic studies enrollment rate
ES in grade 90.519   
ES in grade 100.054   
ES in grade 110.115   
ES in grade 120.311   
Ever enrolled in ES0.190   
No. of students24,246 4,61519,631
Note: Measures for demographic characteristics and academic performance from eighth grade for students in the balanced panel.
*
p < .01.
Table 1 provides baseline (grade 8) descriptive statistics for the students in the balanced panel.3 The group of SFUSD students who enrolled in ES (ever ES) included higher shares of Latinx students (35%), Black students (10.2%), and students who were eligible for special education services (13.7%) compared with students who never enrolled in ES (never ES). Additionally, the ever ES group included lower shares of emergent bilingual (66.4%), Asian (41.0%), and White students (7%) and had a lower average grade 8 GPA (2.94) than students who never enrolled in ES (3.36). Most of the students who took ES did so in grade 9 (52%), whereas 31.1% were in grade 12, 11.5% were in grade 11, and 5.4% were in grade 10.
Due to our partner district's policy on student data privacy protection, individual measures of student poverty were not available. However, the district publicly reported school-level share of students classified as socioeconomically disadvantaged. Across SFUSD high schools, ~60% of students fell into this category, with rates of socioeconomic disadvantage at the school level ranging from 20 to 75% for the 2022–23 school year.

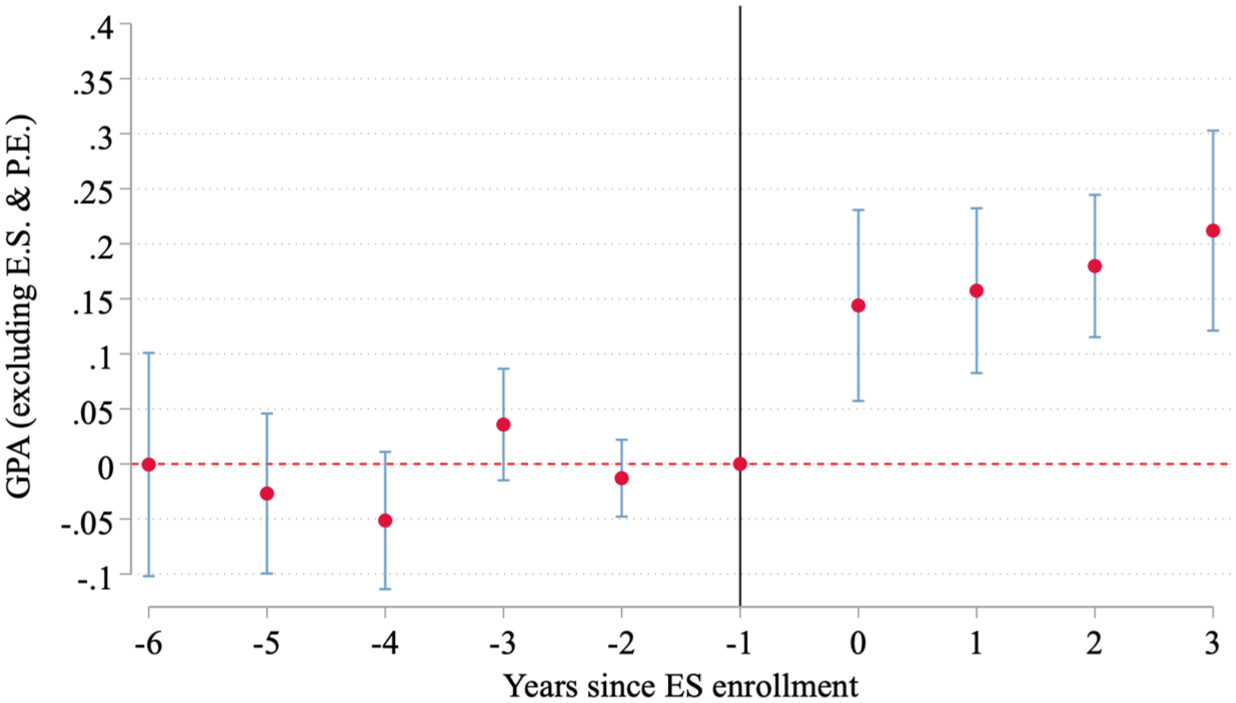
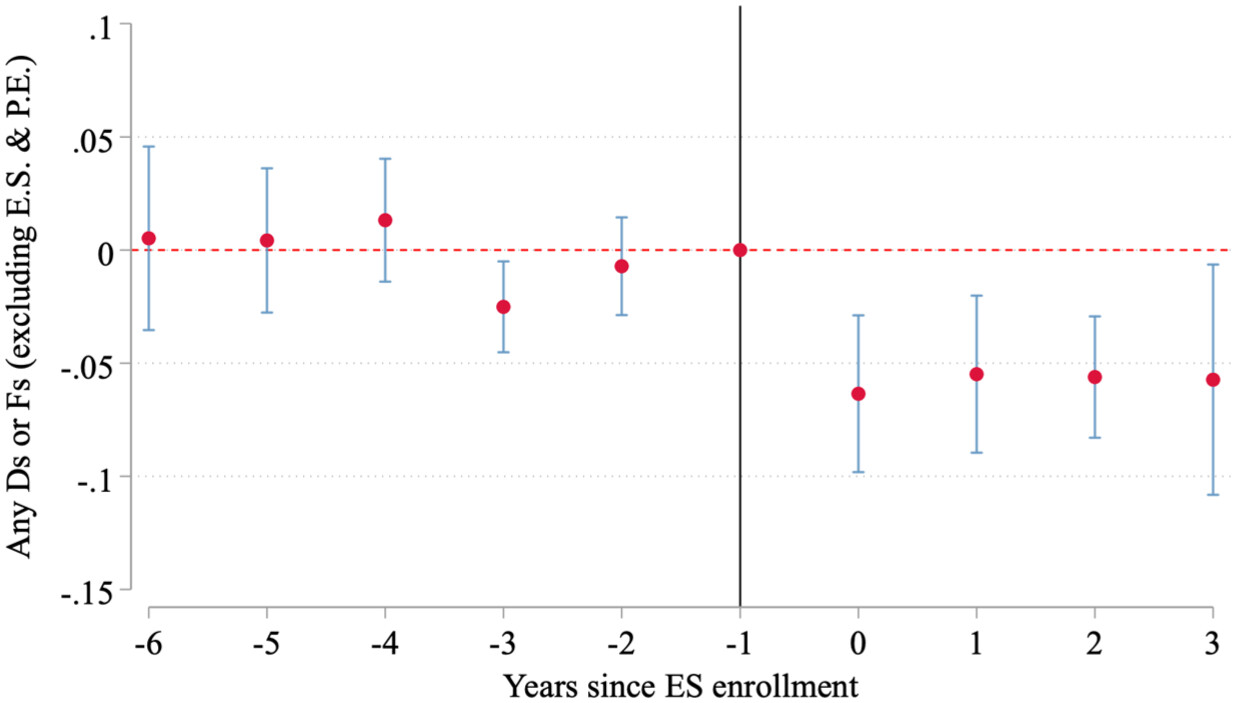
Identification Strategy

Student selection into ES presents a potential source of bias if students who enroll in ES differ systematically. To address this concern, we used a difference-in-differences (DID) design with two-way fixed effects (TWFE) that leveraged the longitudinal nature of our student panel data. This approach allowed us to estimate within-student changes in academic performance (e.g., GPA or course failure) before and after ES enrollment while accounting for time-invariant characteristics that might influence academic trajectories (e.g., motivation and prior achievement). Prior studies have used similar student fixed-effects models to evaluate the effects of special education programs on academic performance and economic returns to earning postsecondary credentials (Meyer et al., 2022; Schwartz et al., 2021; Xu & Trimble, 2016).
Specifically, we estimated a TWFE event-study approach as follows:
yig=α+j=62βj(ESEnrollig)+k=03βk(ESEnrollig)+θi+πg+εig
(1)
where yig represents the academic outcome of interest (GPA or course failures) for student i in grade g. The key independent variable, ESEnrollig, is a set of indicator variables denoting the number of years before or after a student first enrolled in ES. We omit the year before enrollment (j=1) and use it as the reference category to capture baseline differences between treated and untreated students. The student fixed effect θi captures idiosyncratic time-invariant individual characteristics such as race/ethnicity, gender, and other unobserved attributes (e.g., motivation). Additionally, πg is a grade fixed effect that captures systematic differences in enrollment and outcomes across grades. The error term εig is clustered at the school level to account for within-school correlation; With 53 schools, the number of clusters was sufficient, and results were robust to clustering at alternative levels. The number of pre- and post-enrollment observations varied by student based on the grade of first ES enrollment in high school. We examined heterogeneous treatment effects by investigating whether the impact of ES enrollment varied by baseline student characteristics including eighth grade student GPA, race/ethnicity, gender, emergent bilingual status, and special education enrollment. We also explored variation in student outcomes based on the timing of ES adoption across schools.
While the event-study specification provided a dynamic representation of the ES effect over time, we also estimated a more parsimonious within-student fixed-effects model to assess the average treatment effect over a student's secondary school career. In this alternative specification, we substituted the event-study indicators with a binary treatment variable that took the value of 1 for all post-ES enrollment years. For example, a student enrolling in ES in ninth grade would carry a value of 1 for grades 9–12. Formally, we estimated this second specification:
yig=β(ESig)+θi+πg+εig
(2)
where ESig is an indicator that equals 1 if student i enrolled in ES in grade g or any prior grade and 0 otherwise. The student and grade fixed effects remained as specified earlier. Therefore, $\beta$ captures the overall effect of ES participation averaged across all post-enrollment years. To examine heterogeneity, we interacted ESig with key demographic variables to provide estimates of the treatment effect for each student group.
Because our TWFE analysis indicated potential pretrend differences— particularly among ninth grade ES takers, who exhibited declining GPA trajectories relative to nontakers prior to enrollment—we also implemented a synthetic difference-in-differences (SDID) estimator (Arkhangelsky et al., 2021; Candelaria et al., 2024). SDID addresses these concerns by constructing a weighted comparison group that closely matches ES enrollees’ pretreatment trajectory. It does so by incorporating unit- and time-specific weights that minimize pretreatment imbalances in outcomes, effectively relaxing the parallel trends assumption. Formally, the SDID objective function was
(τ^sdid,α^,θ^,π^)=argminτ,α,θ,π[i=1Ng=612(yigαθiπgτ(ESig)2w^isdidλ^gsdid]
(3)
where w^isdid and λ^gsdid denote the student- and grade-specific weights selected to minimize the pretreatment differences (during middle school) between ES takers (i.e., the treatment group) and nontakers (i.e., comparison students). This weighting procedure strengthened the internal validity of our estimates by ensuring that pretreatment trajectories of treated and comparison groups were closely aligned. SDID achieved this alignment by solving a constrained optimization problem that assigns unit and time weights (Arkhangelsky et al., 2021; Clarke et al., 2024). By improving pretreatment fit and differencing out systematic variation, SDID can reduce estimator variance and, in some cases, yield narrower confidence intervals relative to traditional DID. We estimated the SDID model using Stata's sdid command and computed standard errors using a clustered bootstrap procedure (Clarke et al., 2024). Additional robustness checks, including alternate weighting specifications (i.e., substituting calendar year in place of grade and using both year and grade), are presented in Appendix Figure A5 and were qualitatively similar.

Results

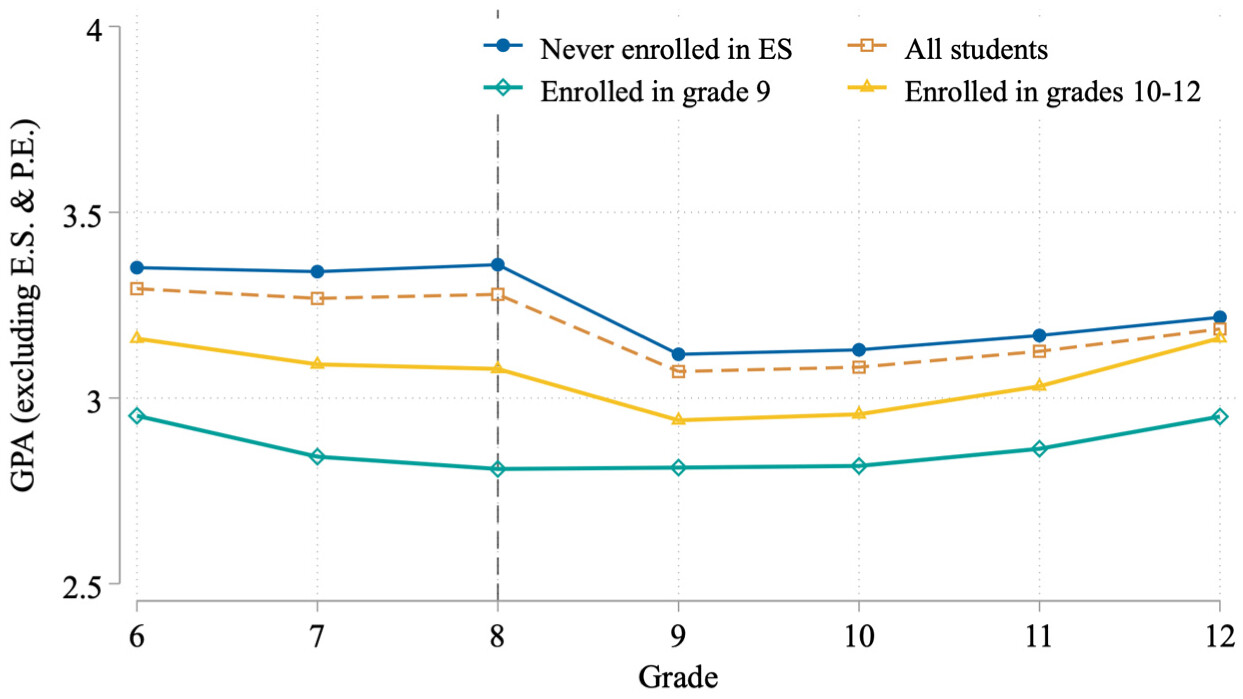
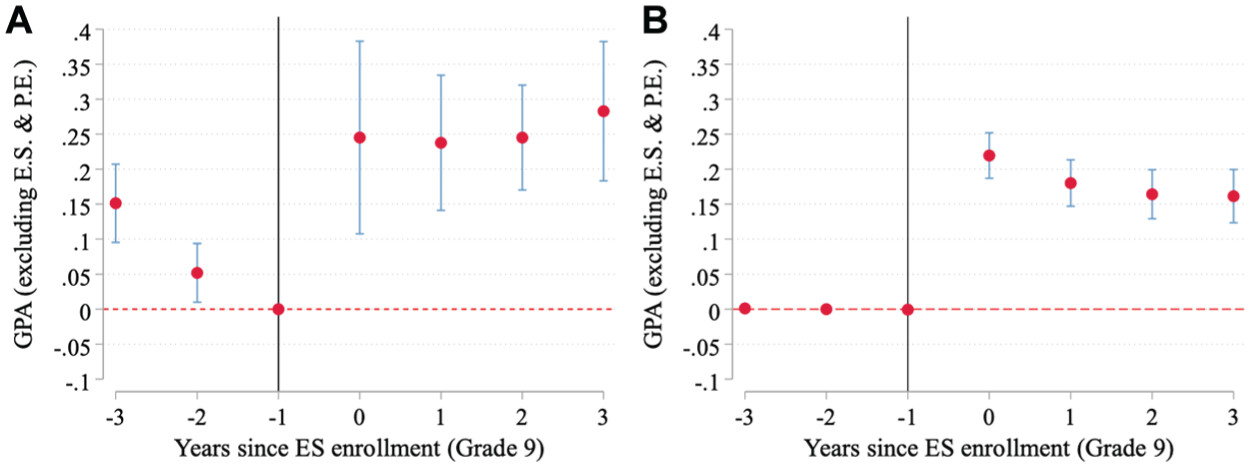
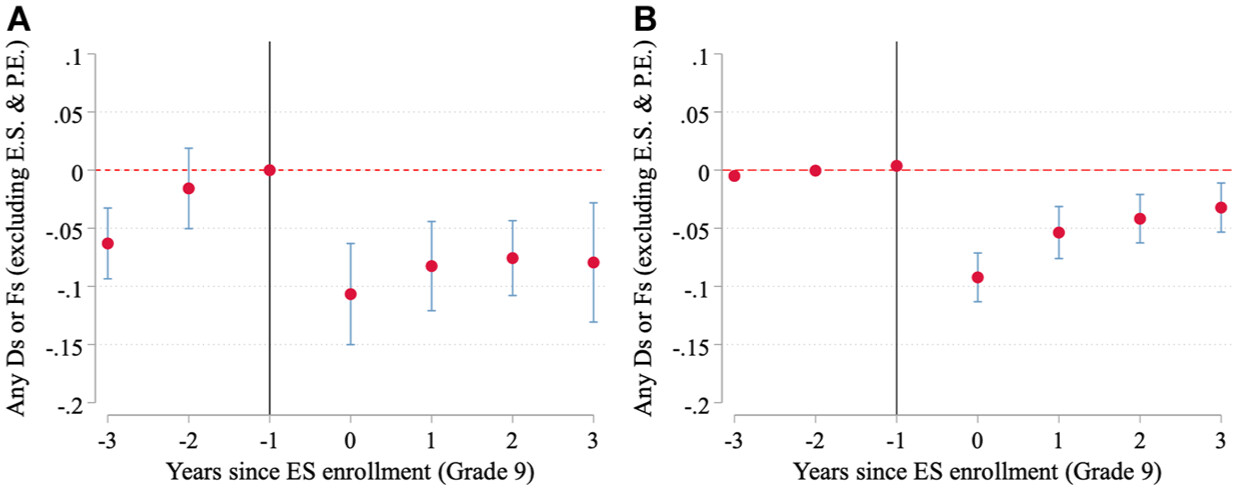
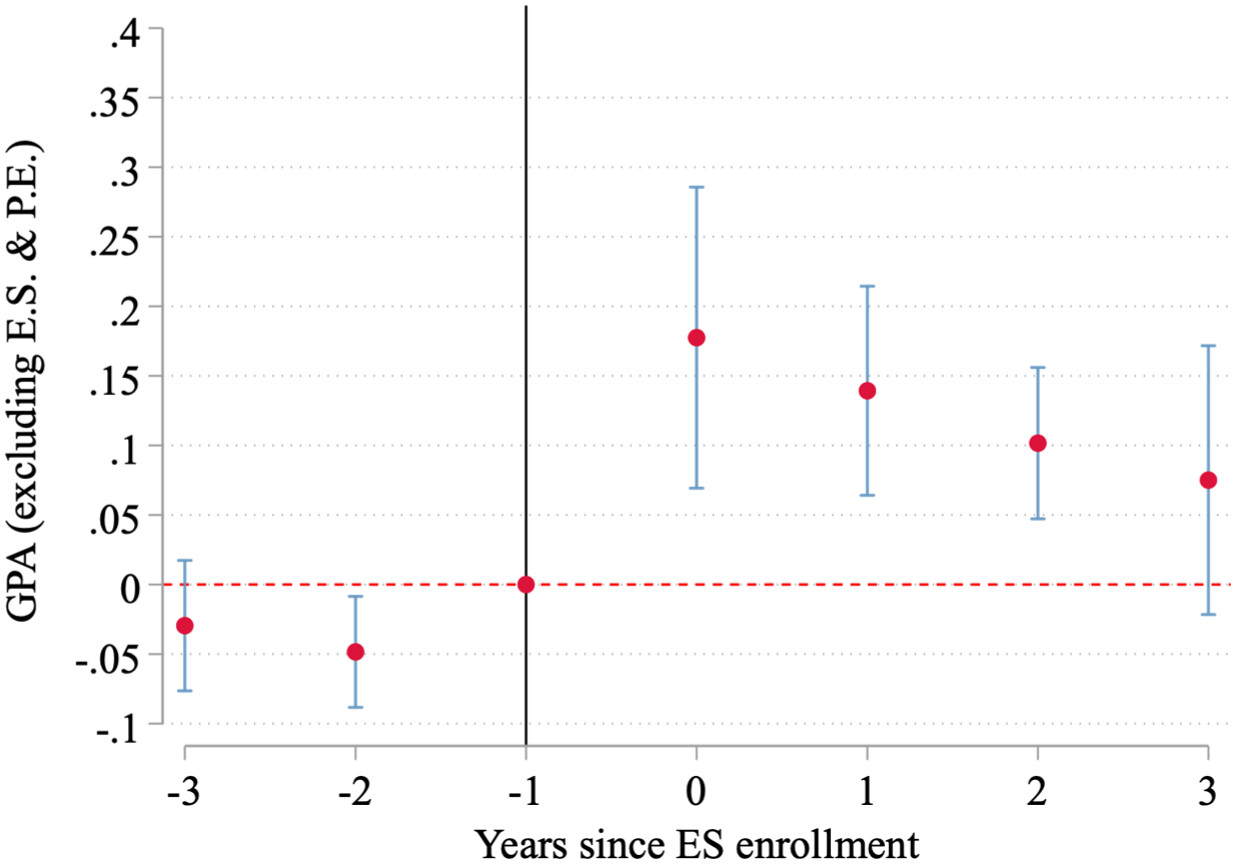
Trends in GPA Across Secondary Grades

Figure 2 presents unconditional mean GPA over time for students in the balanced panel, grouped by ES enrollment. Students who eventually enrolled in ES showed declining GPAs during middle school, and by eighth grade, future ninth grade ES enrollees had a GPA that was 0.5 points lower, on average, than students who never enrolled. At the transition to ninth grade, students who never took ES (roughly 80% of the sample) exhibited a noticeable GPA decline, whereas those who enrolled in ES in ninth grade did not, suggesting that ES enrollment may mitigate ninth grade transition effects. By contrast, students who first enrolled in ES in grades 10–12 had higher middle school GPAs than ninth grade ES enrollees.
Figure 2. Grade-point average trajectories by student enrollment in ethnic studies.
Note. Trends in mean GPA by grade levels and ethnic studies enrollment based on a balanced panel of students attending the SFUSD from grades 6 through 12.
These descriptive comparisons underscore the selection into ES courses by prior GPA as well as other student characteristics (see Appendix Table A2). This selection into ES courses likely biased the observed GPA differences in Figure 2. To address this concern, our main analyses relied on a student fixed-effects model that accounted for time-invariant observed and unobserved traits and allowed for stronger causal inferences regarding the impact of ES enrollment.

Main Estimates

Next, we explored the effects of ES enrollment on annual GPA and course failures using a student fixed-effects event-study design. The x-axis in our event-study plots (Figures 36) represented grades relative to ES enrollment. The point estimate for year 0 represented the effect for the grade level in which students enrolled in ES relative to students who never enrolled. Accordingly, the vertical lines represent confidence intervals, using robust standard errors clustered at the school level.
Figure 3. Effects of ethnic studies enrollment on overall grade-point average.
Note. Event-study estimates of ethnic studies enrollment in high school (see Equation 1) based on a balanced panel of students attending the SFUSD from grades 6 through 12.
Figure 4. Proportion of high school students enrolled in ethnic studies by year.
Note. Event-study estimates of ethnic studies enrollment in high school (see Equation 1) based on a balanced panel of students attending the SFUSD from grades 6 through 12.
Figure 5. Effects of ethnic studies enrollment in grade 9 on grade-point average: (A) two-way fixed-effects model; (B) synthetic difference-in-differences model.
Note. Part A shows event-study estimates of grade 9 ethnic studies enrollment effects (Equation 1) based on a balanced student panel. Part B shows synthetic difference-in-differences event-study estimates (Equation 3).
Figure 6. Effects of ethnic studies enrollment in grade 9 on course failure: (A) two-way fixed-effects model; (B) synthetic difference-in-differences model.
Note. Part A shows event-study estimates of grade 9 ethnic studies enrollment effects (Equation 1) based on a balanced student panel. Part B shows synthetic difference-in-differences event-study estimates (Equation 3).
Figures 3 and 4 pool students who first enrolled in ES between grades 9 and 12, which produced varying lengths of pre- and post-enrollment periods. For example, ninth grade enrollees contributed up to 3 pre- and 4 post-enrollment years, whereas twelfth grade enrollees contributed 6 pre- and only 1 post-enrollment years. As a result, estimates at the far ends of the event-study window (e.g., year −6 or year +3) were identified from a narrower subset of students. Across the pre-enrollment years, coefficients were small and statistically indistinguishable from 0, providing supporting evidence for the parallel-trends assumption that, absent ES enrollment, academic trajectories would have evolved similarly for enrollees and nonenrollees.
In Figure 3, estimates to the right of the vertical line at period −1 are positive with confidence intervals that exclude 0, suggesting statistically significant gains in overall GPA following ES enrollment. By the end of the year immediately after ES enrollment, GPA increased by ~0.15 grade points relative to students who never enrolled, and this improvement persisted through high school, including 3 years after initial enrollment. On average, GPA increased from 3.3 to 3.45 in the first year following ES enrollment, corresponding to an effect size of ~0.21 SDs. Figure 4 shows that ES enrollment also reduced course failures. By the end of the year immediately after enrollment, the likelihood of failing any course decreased by 6.6 percentage points, a 31% reduction relative to the baseline failure rate of 21% (0.17 SD). This effect persisted throughout high school, even 3 years after enrollment, providing compelling evidence that ES improves students’ likelihood of passing their classes.
Given that ES was most often taken in ninth grade and enrollment outside of this typical timing may introduce selection bias, we also estimated the event-study models limited to ninth grade enrollees. This restriction also ensures consistency in the number of pre- and post-enrollment periods in Figures 5 and 6. Figure 5A shows that ninth grade ES enrollment increased GPA by nearly 0.25 grade points in the year of enrollment, with effects persisting through subsequent high school years. Similarly, Figure 6A shows that course failure dropped by 10 percentage points in the year of enrollment—a 34% reduction relative to the mean failure rate of 30%.
Although the results for ninth grade enrollees indicate improvements in GPA and reductions in course failure, both figures show a statistically significant trend in the outcome prior to enrollment in ES. Preexisting trends are often seen as problematic because they can suggest that post-treatment effects merely reflect prior trajectories, potentially biasing estimates. In our case, the reversal of pre-treatment trends in the post-treatment estimates suggests that the estimates likely represent a lower-bound effect of ES enrollment. The pre-enrollment downward trend also may reflect program dynamics because teachers and guidance counselors may recommend ES to students with declining academic performance. Conversely, it is also plausible that high-performing students with other curricular interests (e.g., music, language, or AP/honors courses) may defer or forego ES enrollment altogether.
We used a third approach, the SDID method, to test the robustness of our main estimates and correct for pretrend violations. Results are shown in Figures 5B and 6B. All pre-enrollment estimates were centered on 0 following the weighting procedure. Figure 5B shows that ninth grade ES enrollment increased GPA by ~0.2 points. Estimates for the three subsequent years remained positive and statistically significant, with modest attenuation over time. SDID estimated effects were slightly smaller than the TWFE estimates in Figure 5A but remained similar in sign and overall magnitude. Similarly, Figure 6B shows comparable results for course failure. SDID estimates suggested slightly smaller reductions in course failure and modest attenuation over time, but both approaches demonstrated a positive effect on the academic trajectories of ninth grade ES enrollees.4
We further examined the pooled effect of ES on GPA and course failure across the high school years using a TWFE specification (Equation 2). Each cell in Table 2 reports estimates from a separate regression, with the first row representing estimates for all students who took the course in any high school grade. Subsequent rows show estimates from regressions estimated separately for student subgroups defined by students’ prior academic performance, demographic characteristics, or academic program participation.
Table 2 Effect of Ethnic Studies on Grade-Point Average (GPA) and Course Failures by Student Characteristics
Student characteristicGPAAny D's or F’s
Overall (N = 24,210)0.174*
(0.040)
−0.056*
(0.016)
Grade 8 GPA categories
GPA <2.0 (N = 1,826)0.167*
(0.032)
−0.049*
(0.016)
GPA 2.0–3.0 (N = 5,343)0.122*
(0.044)
−0.081*
(0.023)
GPA 3.0–4.0 (N = 17,041)0.117*
(0.028)
−0.013
(0.011)
Gender
Male (N = 12,345)0.192*
(0.044)
−0.068*
(0.017)
Female (N = 11,865)0.151*
(0.035)
−0.042*
(0.015)
Race/ethnicity
Black (N = 1,335)0.228*
(0.042)
−0.104*
(0.021)
Latinx (N = 4,904)0.248*
(0.046)
−0.117*
(0.023)
Asian (N = 14,329)0.124*
(0.035)
−0.029**
(0.014)
White (N = 2,098)0.188*
(0.041)
−0.065*
(0.016)
Other (N = 1,544)0.225*
(0.055)
−0.063*
(0.023)
Special education
Yes (N = 2,734)0.185*
(0.041)
−0.109*
(0.019)
No (N = 21,476)0.170*
(0.040)
−0.049*
(0.016)
Emergent bilingual
Yes (N = 16,589)0.163*
(0.040)
−0.051*
(0.017)
No (N = 7,621)0.194*
(0.043)
−0.066*
(0.016)
Note: Point estimates are from within-student two-way fixed-effects models of ethnic studies enrollment in high school (see Equation 2). Each estimate or set of estimates is from a separate regression and employs a distinct specification and sample using the balanced panel of student in the San Francisco Unified School District. Robust standard errors clustered by school level are reported in parentheses.
*
p < .01; **p < .05.
As shown in the first row of Table 2, TWFE estimates indicated that ES enrollment in any high school grade improved academic performance. On average, GPA increased by 0.17 grade points (0.24 SD) relative to a grade 8 GPA mean of 3.3 for students who never enrolled. Among our sample of ES takers, this translated to an additional 400 students having GPAs that met or exceeded the University of California GPA eligibility threshold of 3.0 (a 15% increase).5 Course failures declined by 5.6 percentage points (0.14 SD) relative to a mean failure rate of 21%, representing a 27% reduction, a particularly meaningful improvement for lower-performing students most at risk of falling behind or not graduating. These pooled effects were comparable in magnitude to the dynamic estimates presented in Figures 36 and underscore the practical significance of ES enrollment.

Treatment-Effect Heterogeneity

Our primary treatment-effect estimates may mask important differences across student subgroups. The impact of ES course enrollment could vary by demographic characteristics and academic preparation, several of which have not been explored in prior research. Previous studies using regression discontinuity designs focused only on students near the eligibility threshold (eighth grade GPA of 2.0), limiting evidence for higher-GPA students (Bonilla et al., 2021; Dee & Penner, 2017). We extended this work by estimating effects across levels of prior academic achievement, racial/ethnic background, and gender and among students in special education and emergent bilingual programs. Each coefficient in Table 2 reports estimates from separate regressions for each subgroup. We formally tested for differences in ES impact across subgroups using interaction terms (see Appendix Table A4).
As shown in Table 2, students across the grade 8 GPA distribution experienced positive, statistically significant GPA gains following ES enrollment, although the magnitude varied by prior academic performance. Students with the lowest eighth grade GPA (<2.0) benefited most, with a 0.17-point increase. Students with GPAs between 2.0–3.0 and >3.0 showed gains of 0.12 and 0.11 points, respectively. Gains for the lowest (<2.0) and middle (2.0–3.0) GPA groups were larger and statistically significant using the highest (>3.0) as the reference group (see Appendix Table A4). Lower GPA groups (<2.0 and 2.0–3.0) also saw the greatest reductions in course failure rates because higher-performing students were less likely to receive D's or F's initially. The lower GPA groups experienced larger and statistically significant reductions in failure rates compared with those with the highest GPA (>3.0). Notably, even students with the highest grade 8 GPAs demonstrated a positive and statistically significant GPA gain of 0.12 points (see Table 2).
We also found positive effects across gender and racial/ethnic subgroups. Academic gains were observed for both male and female students, with larger impacts for males. Male students gained 0.19 points in GPA and reduced course failures by 0.07, whereas female students gained 0.15 points in GPA and reduced failures by 0.04; these gender differences were statistically significant (see Appendix Table A4). All racial and ethnic groups showed improvements in GPA and reductions in course failures after ES enrollment. Black and Latinx students had the largest gains, with GPA increases of 0.23 and 0.25 points and reductions in course failures of 0.10 and 0.12, respectively. Black students showed significantly larger gains than Asian students6 (the reference group; see Appendix Table A4), whereas Latinx students’ gains were not significantly different. Across all groups, ES enrollment produced statistically significant improvements in GPA and course failures, with no evidence of negative effects. Although ES courses centered the experiences of communities of color, students from all racial and ethnic backgrounds benefited.
Table 2 shows that ES benefited students regardless of special education or emergent bilingual program participation. Gains were larger for students receiving special education services (0.19 vs. 0.17 points for GPA; 0.11 vs. 0.05 for failures), and these differences were statistically significant (see Appendix Table A4). Across core subjects, ES enrollment increased GPA in all areas, with the largest improvements in math (0.27 points) and science (0.20 points; see Table 3). These results suggest that ES supports academic outcomes beyond the course itself.
Table 3 Effect of Ethnic Studies Enrollment on Grade-Point Average (GPA) by Subject Area
Effect/factorOverall GPACore subjectsEnglishMathScienceSocial science
(1)(2)(3)(4)(5)(6)
Overall0.174*
(0.040)
0.186*
(0.039)
0.154*
(0.035)
0.266*
(0.049)
0.199*
0.049
0.199*
0.049
No. of students24,24624,24624,24624,24624,24624,246
Note. Point estimates are from within-student two-way fixed effects models of ES enrollment on subject-specific GPA (see Equation 2). Column 2 shows GPAs for core subjects: English, math, science, and social science. Robust standard errors clustered by school level are in parentheses.
*
p < .01.

Robustness

Given the consistent findings across diverse student subgroups, we next examined robustness beyond the main specifications. A potential threat to identification was the exclusion of students not continuously enrolled in the district from grades 6 through 12, which could bias estimates through district attrition. To address this, we re-estimated models with the unbalanced sample and found similar results. Appendix Figure A1 shows GPA effects ranging from 0.14 to 0.22 points in the year following ES enrollment, whereas Appendix Figure A2 presents comparable finds showing reductions in course failures.
Another potential threat was bias from unequal attrition between ES enrollees and nonenrollees, which we observed to some extent, varying by GPA. To assess its impact, we implemented several imputation strategies for missing GPA values: (a) replace with zero, (b) replace with 4.0, and (c) imputing the mean of a student's two most recent available years (Table 4). The extreme imputation approaches in columns (1) and (2) have been used in prior research to address missing high school outcomes (Gershenson et al., 2022). We also re-estimated our main model with our unbalanced panel. Across all approaches, ES enrollment continued to increase GPA, although the effect sizes varied somewhat by prior academic performance.
Table 4 Effect of Ethnic Studies Enrollment on Grade-Point Average (GPA), Various Missing GPA Corrections
EffectBalanced panelImputed GPA all 0sImputed GPA all 4sImputed GPA meanUnbalanced panel
(1)(2)(3)(4)(5)
Overall0.174*
(0.040)
0.130*
(0.031)
0.211*
(0.042)
0.160*
0.034
0.146*
0.036
No. of students24,24627,74827,74827,74836,010
Grade 8 GPA categories
GPA <2.00.167*
(0.032)
0.214*
(0.036)
0.121*
(0.033)
0.221*
0.036
0.250*
0.038
GPA 2.0–3.00.122*
(0.044)
0.163*
(0.042)
0.125*
(0.039)
0.158*
0.042
0.154*
0.048
GPA >3.00.117*
(0.028)
0.103*
(0.024)
0.121*
(0.029)
0.118*
0.027
0.096*
0.026
Note. Point estimates are from within-student two-way fixed-effects models of ethnic studies enrollment on GPA (see Equation 2). Columns (2)–(4) use different imputation methods for missing GPAs: 0, 4.0, or the mean of the student's two most recent GPAs. Robust standard errors clustered by school are in parentheses.
*
p < .01.
An important alternative explanation for our findings is that ES may attract teachers whose overall quality—not just the course itself—drives student success across subjects. Interviews with ES educators and district leaders indicated that while many teachers were recruited for their ES content expertise, others had varied backgrounds and interest in the subject (Penner et al., 2025). Thus, ES teachers may be selected for qualities that persist across courses.
Most ES teachers also taught additional non-ES subjects, most commonly world history, U.S. history, economics, English, algebra I, and college/career readiness, with other courses taught less frequently. To test whether ES teachers produced similar gains in other subjects, we conducted a falsification test on these six non-ES courses. Using an event-study design analogous to our main approach, we treated the first assignment to an ES teacher in a non-ES course as the treatment, comparing students who had never been taught by an ES teacher with those who were, excluding students who took ES with the same teacher. Results (see Appendix Figure A3) show no significant changes in GPA after this first non-ES course with an ES teacher. This suggests that the positive effects observed in ES courses are attributable to the course itself or the course content as enacted by these teachers rather than the teacher alone.
An additional alternative explanation is that taking the ES course might replace a more challenging or particularly relevant class, potentially boosting the student's observed GPA. We examined these counterfactual courses and formally tested changes in enrollment associated with ES in Appendix Tables A5 and A6. We found that ninth grade students who took ES primarily replaced world history while postponing courses such as world languages, visual and performing arts, and other electives. They typically took these courses in grade 10 or grade 11. There was no evidence that ES students reduced the total number of courses in core subjects such as math, science, English, or social studies. Although they took fewer world languages courses overall, they still met graduation requirements. ES students were equally likely as their peers to fulfill required courses for graduation (see Appendix Table A6, panel A), and we observed no significant decline in enrollment in advanced courses such as honors or AP classes (see Appendix Table A6).
While ES enrollment shifted the timing of some courses, school and district leaders reported that most schools had expanded their schedules from six to seven periods to accommodate ES alongside other requirements. This scheduling change appears to have mitigated constraints on students’ access to other courses. Taken together, the falsification tests, course substitution analysis, and district implementation suggested that academic impacts were unlikely to be explained by teacher spillovers or displaced coursework.

Discussion

This study provides the first districtwide causal evidence of ES effectiveness, reaching thousands of students. Using longitudinal student-level data and a student fixed-effects design, we found consistent improvements in academic performance measured by GPA and course failures across multiple robustness checks, including attrition adjustments, sample restrictions, and falsification tests. Unlike many interventions that show limited effects for older students (Cullen et al., 2013; Heckman & Kautz, 2012), ES demonstrates sustained benefits at scale for high school students. Importantly, ES enrollment produces a 15% increase in students meeting the 3.0 GPA threshold for University of California admission eligibility—equivalent to 400 additional students in our sample. Moreover, our estimated effect size of 0.24 SD from ES enrollment exceeds the average pooled effect size of large-scale tutoring programs serving 400–999 students (0.21 SD) and those serving >1,000 students (0.16 SD), as reported by Kraft et al. (2024). Furthermore, following Kraft’s (2020) framework, the effect sizes we observed qualify as large for education interventions.
Notably, our study provides new, broader evidence that the benefits of ES extend across all student groups—regardless of race, ethnicity, academic preparation, gender, special education status, or emergent bilingual status. Effects were strongest for Black and Latinx students, students in special education, students with lower prior GPAs, and male students. These results show that districtwide ES implementation can drive substantial academic gains across a diverse student population. Previous studies (e.g., Bonilla et al., 2021; Cabrera et al., 2014; Dee & Penner, 2017) found strong effects in small pilot settings, typically among lower-achieving or specific racial/ethnic groups. Our observed effect on grades was smaller than the treatment-on-the-treated pilot estimate (1.4 GPA points) from Dee & Penner (2017) but more closely aligned with their intent-to-treat estimate (0.27 GPA points). Importantly, our findings show that districtwide implementation delivers benefits for both higher- and lower-achieving students, even in the presence of possible ceiling effects.
These results reinforce the role of ES in improving educational outcomes across diverse student populations. While we cannot pinpoint a single mechanism, qualitative evidence suggests that the program maintained key hallmarks of ES pedagogy and curriculum throughout the scale-up (Penner et al., 2025). The course provided students with opportunities to affirm their identities, learn about other cultures, and build relationships with peers, community, and teachers. The SFUSD's locally initiated curriculum also evolved to reflect student demographics and classroom needs, consistent with research showing that successful replication depends on how practical knowledge is developed and applied (Peurach & Glazer, 2012).
Beyond documenting academic gains, our findings also point to the importance of understanding why ES matters. Theoretical perspectives help explain how ES content and pedagogy support students’ development and resilience, particularly as they navigate school transitions and experiences of discrimination. ES courses are well positioned to engage students during this critical developmental stage because life-course theory identifies adolescence as a key period for identity formation and civic development (Erikson, 1968). They foster critical consciousness—a combination of awareness of structural inequality, reflection on its causes and consequences, and belief in one's ability to effect change (Diemer et al., 2016; Freire, 2014; Pinedo et al., 2025)—by encouraging students to examine injustice, connect personal and community experiences, and learn about civic action. ES also supports ERI development, through which students make meaning of their racial and cultural group membership, fostering belonging, motivation, and purpose in school (Rivas-Drake et al., 2014; Umaña-Taylor et al., 2014). In sum, ES leverages the developmental opportunities of adolescence while providing tools for critical analysis and academic engagement, thereby strengthening both academic and socioemotional outcomes.
Grounding ES in these theoretical traditions highlights both its educational value–supporting identity, equity, and critical engagement and its vulnerability in today's politically contested landscape. Public education is increasingly shaped by debates over diversity, equity, and inclusion (DEI), with anti-DEI policies and efforts to censor curricula on race and inequality spreading across states. Decisions about whether, when, and how ES courses are offered often hinge on district politics, resource allocation, and community advocacy. In our partner district, for example, teachers and students repeatedly mobilized to expand ES opportunities, facing organized opposition throughout the scale-up process. These dynamics underscore that sustaining ES is not solely an academic or pedagogic challenge but also a political and structural one.
Despite these challenges, our study demonstrates that ES delivers measurable academic benefits and remains effective even when scaled districtwide. In the context of 2025, ES courses represent a vital tool for advancing educational equity. Affirming students’ identities and fostering culturally responsive schooling are equity practices that challenge structural exclusion (Neal et al., 2023). Our findings extend this tradition by showing that ES improves academic outcomes even at scale, strengthening the case for continued investment in culturally responsive education. In this sense, ES coursework not only supports individual achievement but also provides a systemic, scalable strategy for promoting equity across diverse school contexts and an entire school system.

Limitations

These findings suggest that ES can produce substantial academic gains as it scales. However, despite providing one of the most generalizable evaluations of ES to date, our study has important limitations. While our sample was larger and included a broader range of students than previous studies, it remains limited to a single-district context where the pilot program was initially successful and to students who either selected the course or were placed into it by a counselor. Moreover, our study measured program impacts during a period of expansion rather than under a graduation mandate, although in some schools and years enrollment was universal or nearly so. Importantly, the scaled-up course in the SFUSD was primarily yearlong, whereas California's upcoming graduation requirement mandates only a one-semester ES course. Thus, it remains uncertain whether similar effects would occur under a mandated one-semester requirement in this or other districts. Future research should evaluate ES in other districts and identify supports necessary to sustain its impact under statewide implementation.
It is also important to consider differential effects by prior achievement. Students with higher eighth grade GPAs showed smaller gains than lower-achieving peers. While this may suggest more limited benefits for higher-achieving students, it also could reflect ceiling effects becauses these students have less room for improvement.
Finally, academic outcomes such as GPA and course failures are likely secondary effects of taking an ES course. Students in ES and other courses that embed culturally responsive pedagogy may first experience affirmation of their cultural and ethnic identity, critical consciousness, and civic engagement before seeing measurable academic gains (Nelsen, 2021; Seider & Graves, 2020). Our current work could not assess these first-order outcomes because they were typically not included in administrative data. Future research should measure such psychological and developmental processes to better understand the mechanisms through which ES influences academic outcomes.

Conclusion

Our study provides large-scale evidence that ES can improve academic outcomes and reduce disparities when implemented with fidelity and support. Using a difference-in-differences design, we found that enrollment in ES courses increased GPA and reduced course failure rates, with especially strong effects for academically vulnerable students, Black and Latinx students, male students, and those with individualized education plans. These benefits extended across the entire student population, suggesting that ES can serve as a broadly impactful intervention while also advancing equity.
At the same time, we are cautious about generalizing beyond the studied district, an early adopter that invested significant resources in staffing, professional development, and curriculum development. These conditions likely contributed to the success of the program and may not yet exist in all districts as California moves toward broader implementation. Ensuring that the expansion of ES is community driven, adequately resourced, and research informed will be critical for realizing its full potential.
Taken together, our findings highlight both the potential and the responsibility of scaling ES. At a moment when debates about race, identity, and curriculum have intensified, our results show that ES coursework can foster belonging, engagement, and academic success across diverse student groups. Far from being a source of division, ES represents a powerful tool for equity and learning, and continued investment in thoughtful, community- and research-based expansion offers a promising path forward for districts in California and beyond.

Acknowledgments

We thank seminar and conference participants from the University of California, Irvine's Center for Administrative Data Analysis and Education Policy and Social Context Lab, the Association of Education Finance and Policy, and the Association of Public Policy Analysis and Management for their feedback, the Stanford–San Francisco Unified School District Research Practice Partnership, California Education Partners, and educators and staff from the San Francisco Unified School District for their partnership and support of this research.

Declaration of Conflicting Interests

The authors declare no potential conflicts of interest with respect to the research, authorship, and/or publication of this article.

Funding

This research was supported by the William T. Grant Foundation (Grant Nos. 190-233 and 201-005), the William and Flora Hewlett Foundation (Grant No. 2021-3072), and the National Institute of Child Health and Human Development (Grant No. R01HD094007).

ORCID iDs

Footnotes

1 We currently lack indicators of school engagement. We cannot examine high school graduation and other nondynamic outcomes of interest with our current identification strategy.
2 The analytic sample included a small share of students (~3%) who took a 6-week middle school ethnic studies elective that differed substantially in depth and content from the year-long high school course.
3 We used the most recent pre–high school data as the baseline year, typically eighth grade, because it preceded their first opportunity to take ethnic studies. If eighth grade data were unavailable, we used information from seventh or sixth grade.
4 We also implemented an approach using inverse-propensity-score weights to condition on pretreatment covariates correlated with selection into treatment (Roth et al., 2023). Results, shown in Appendix Figure A6, are largely consistent with the TWFE and SDID estimates. As Callaway and Sant’Anna (2021) noted, in the case of the grade 9 treatment comparison, differences in observed characteristics create nonparallel pretrends, meaning unconditional DID strategies may not recover sensible causal parameters (Abadie, 2005; Heckman et al., 1997, 1998). We thus used inverse-propensity-score weights to balance the observations by their conditional treatment probability using observable baseline characteristics and estimating the effect of ES as a weighted difference in means. Propensity-score approaches minimize the importance of cases outside the area of common support so that only cases that could plausibly be in either treatment or control influence estimates.
5 Models estimated using the sample of ninth grade ES takers suggested that the increase is even larger, with up to an 18% increase in students meeting the University of California minimum GPA threshold.
6 Asian students are the reference group both because they are the largest racial/ethnic subgroup in the district and to decenter White students as the norm. For comparability, alternate results are provided in the Appendix.

Appendix

Table A1 Baseline Descriptive Statistics, Unbalanced Panel
StatisticOverall sampleEver enrolled in ethnic studiesNever enrolled in ethnic studies
MeanSDMeanMean
Demographics
Female0.4830.500.4810.483**
Special education0.1220.330.1250.121
Emergent bilingual0.6480.480.6460.649
Black0.0810.270.1140.073
Latinx0.2530.430.4130.215*
Asian0.5010.500.3140.545*
White0.0930.290.0770.097*
Other0.0730.260.0830.070**
Academic performance   
Grade 8 overall grade-point average (GPA)3.0970.902.8303.163*
Grade 8 course failure rate0.3400.470.4180.321*
Grade 8 GPA <2.00.1490.360.2180.132*
Grade 8 GPA 2.0–3.00.2460.430.3070.230*
Grade 8 GPA >3.00.6050.490.4750.637**
Ethnic studies enrollment rate   
Grade 90.673   
Grade 100.064   
Grade 110.084   
Grade 120.179   
Ever enrolled in ethnic studies0.192   
No. of students60,364 11,59148,773
Note. Measures for demographic characteristics and eighth grade academic performance for students in the unbalanced panel.
*
p < .01.
Table A2 Baseline Descriptive Statistics, Comparing Balanced and Unbalanced Panel
StatisticBalanced panelUnbalanced panel onlya
MeanSDMeanSDDifference (mean)
Demographics
Female0.4900.500.4780.50−0.012*
Special education0.1200.330.1230.330.003*
Emergent bilingual0.6860.460.6230.48−0.063*
Black0.0550.230.0980.300.042*
Latinx0.2030.400.2860.450.083
Asian0.5910.490.4400.50−0.152*
White0.0870.280.0980.300.011**
Other0.0640.240.0790.270.015**
Academic performance
Grade 8 overall grade-point average (GPA)3.2790.772.8970.98−0.382*
Grade 8 course failure rate0.2510.430.4000.490.149
Grade 8 GPA <2.00.0870.280.2150.410.128
Grade 8 GPA 2.0–3.00.2270.420.2650.440.038**
Grade 8 GPA >3.00.6860.460.5190.50–0.166*
Ethnic studies enrollment rate
Ever enrolled in ethnic studies0.1900.390.1930.390.003*
No. of students24,246 36,118  
Note. Measures for demographic characteristics and eighth grade academic performance for students in the balanced and unbalanced panels.
a
To test sample differences, columns (3) and (4) present statistics for students only in the unbalanced panel, excluding those in both samples.
*
p < 0.05, **p < 0.01.
Table A3 Effect of Ethnic Studies (ES) Enrollment by Student Characteristics, Unbalanced Panel
EffectES enrollment in grade 9ES enrollment in grades 9–12
Grage-point average (GPA)Any D's or F’sGPAAny D's or F’s
Overall0.172* (0.044)−0.059*
(0.015)
0.144* (0.037)−0.048*
(0.015)
Grade 8 GPA categories
GPA <2.00.223* (0.045)−0.053**
(0.019)
0.232* (0.040)−0.057*
(0.012)
GPA 2.0–3.00.136**(0.045)−0.069*
(0.023)
0.140* (0.045)−0.066*
(0.021)
GPA 3.0–4.00.122* (0.038)−0.019
(0.013)
0.099* (0.029)−0.009
(0.012)
Gender
Male0.191*(0.048)−0.079*
(0.017)
0.164*(0.041)−0.058*
(0.016)
Female0.144* (0.042)−0.031**
(0.015)
0.122*(0.035)−0.036*
(0.015)
Race/ethnicity
Black0.240*(0.043)−0.100*
(0.022)
0.222*(0.037)−0.094*
(0.017)
Latinx0.267*(0.053)−0.126*
(0.025)
0.246*(0.047)−0.097*
(0.019)
Asian0.152* (0.042)−0.045*
(0.013)
0.112*(0.029)−0.024**
(0.011)
White0.248*(0.044)−0.081*
(0.018)
0.144*(0.041)−0.042*
(0.015)
Other0.233*(0.066)−0.047
(0.028)
0.157*(0.049)−0.052**
(0.022)
Special education
Yes0.221*(0.039)−0.114*
(0.021)
0.230* (0.036)−0.106*
(0.015)
No0.173*(0.047)−0.051*
(0.015)
0.140*(0.039)−0.041*
(0.015)
Emergent bilingual
Yes0.174*(0.046)−0.058*
(0.017)
0.140*(0.038)−0.041**
(0.016)
No0.200*(0.046)−0.062*
(0.016)
0.180*(0.043)−0.065*
(0.016)
Note. Point estimates shown are from within-student two-way fixed-effects ethnic studies enrollment (see Equation 2). Each estimate employed a distinct specification and sample, using the unbalanced panel of students in the SFUSD. Robust standard errors clustered by school level are reported in parentheses.
*
p < .01; **p < .05.
Table A4 Effects of Ethnic Studies (ES) Enrollment on Overall Grade-Point Average (GPA) and Course Failure, Interactions
FactorGPACourse failure
(1)(2)(3)(4)(5)(6)(7)(8)(9)(10)(11)(12)
ES0.059*
(0.029)
0.124**
(0.035)
0.136**
(0.037)
0.168**
(0.041)
0.159**
(0.039)
0.191**
(0.044)
0.001
(0.010)
−0.036*
(0.015)
−0.042**
(0.014)
−0.074**
(0.017)
−0.051**
(0.015)
−0.068**
(0.017)
ES × grade 8 GPA <2.00.374**
(0.040)
     −0.157**
(0.014)
     
ES × grade 8 GPA 2.0–3.00.144**
(0.033)
     −0.088**
(0.021)
     
ES × Male 0.095**
(0.017)
     −0.038**
(0.008)
    
ES × Black  0.108**
(0.036)
0.076***
(0.045)
    −0.039***
(0.022)
−0.007
(0.023)
  
ES × Latinx  0.051
(0.036)
0.019
(0.044)
    −0.016
(0.022)
0.016
(0.024)
  
ES × Asian  0.000−0.032
(0.033)
    0.0000.032***
(0.017)
  
ES × White  0.032
(0.033)
0.000    −0.032***
(0.017)
0.000  
ES × other  0.081*
(0.035)
0.050
(0.050)
    −0.025
(0.022)
0.007
(0.026)
  
ES × special education    0.111**
(0.037)
     −0.042*
(0.017)
 
ES × emergent bilingual     −0.026     0.017
(0.012)
Note. Point estimates are from within-student two-way fixed-effects models of ES enrollment on GPA (see Equation 2), including interaction terms, using a balanced panel. Robust standard errors are clustered by school level. Asian students are the reference group for other race/ethnicity categories in columns (3) and (9); White students are the reference group in columns (4) and (10); and students with grade 8 GPA >3 are the reference group for the other GPA categories in columns (1) and (7). A joint hypothesis test for grade 8 GPA categories (columns 1 and 7) was highly significant (p < .001). A similar test for race/ethnicity categories was significant for GPA (columns 3 and 4; p < .05) but not for course failure (columns 9 and 10).
*
p < .05; **p < .01; ***p < .1.
Table A5 Course Substitution and Ethnic Studies Enrollment, by Subject Area and Grade Level
Grade level(1)(2)(3)(4)(5)(6)(7)(8)
Total coursesMathLab scienceEnglishWorld languagesVisual and performing artsUC- approved electivesNon-UC-approved electives
9th grade0.081 (0.451)0.052 (0.451)−0.076 (0.451)−0.083 (0.451)−0.843* (0.451)−0.498** (0.451)1.678* (0.451)−0.191** (0.451)
10th grade0.636 (0.427)0.01 (0.062)0.04 (0.061)0.048 (0.048)0.124 (0.110)0.116 (0.177)−0.3 (0.343)−0.101 (0.066)
11th grade0.620*** (0.314)−0.045 (0.070)−0.041 (0.062)−0.03 (0.052)0.185*** (0.109)0.459* (0.138)−0.329 (0.303)0.033 (0.108)
12th grade−0.102
(0.481)
−0.075 (0.073)−0.178 (0.138)0.11 (0.083)0.142 (0.091)0.183 (0.167)−0.652** (0.293)−0.041 (0.070)
Grades 9–12
0.416** (0.174)−0.005 (0.037)−0.075 (0.046)0.00 (0.038)−0.236* (0.062)0.002 (0.054)0.371* (0.079)−0.120** (0.052)
Note. Point estimates from ethnic studies enrollment in grade 9 on the number of course taken by subject area (similar to Equation 2).
*
p < .01; **p < .05; ***p < .1.
Table A6 Course Requirement Met for High School Graduation
Graduation requirement met by subject area
CourseMathLab scienceEnglishWorld languagesVisual and performing artsSocial science
Ethnic studies0.025*(0.011)0.017* (0.007)0.003 (0.034)−0.002 (0.033)−0.012 (0.015)−0.029 (0.025)
B. Number of AP and honors courses by grade level 
Course/gradeGrade 9Grade 10Grade 11Grade 12Grades 9–12
Ethnic studies0.016 (0.017)−0.016 (0.105)−0.1 (0.150)−0.076 (0.120)−0.166 (0.314)
Note. Estimates from a linear probability model of meeting graduation requirement in panel A and estimates from ordinary least squares model showing the difference in the number of AP and honors courses in panel B, between ethnic studies and non–ethnic studies students.
*
p < .05.
Figure A1. Effects of ethnic studies enrollment on overall grade-point average, unbalanced sample: (A) ethnic studies in any high school grade; (B) ethnic studies in grade 9.
Note. Event-study estimates of ethnic studies enrollment (Equation 1) based on an unbalanced panel of students who attended the San Francisco Unified School District for at least 2 years.
Figure A2. Effects of ethnic studies enrollment on course failure, unbalanced sample: (A) ethnic studies in any high school grade; (B) ethnic studies in grade 9.
Note. Event-study estimates of ethnic studies enrollment (Equation 1) based on an unbalanced panel of students who attended the San Francisco Unified School District for at least 2 years.
Figure A3. Effects of having an ethnic studies teacher in a non–ethnic studies subject on grade-point average.
Note. Event-study estimates of ethnic studies enrollment based on balanced panel of students, excluding students who enrolled in ethnic studies in high school (N = 17,383).
Figure A4. Effects of ethnic studies enrollment on grade-point average by timing of adoption.
Note. Event-study estimates of ethnic studies enrollment based on balanced panel of students.
Figure A5. Effects of ethnic studies enrollment on grade-point average, alternate fixed-effects specifications: (A) includes student and year fixed effects; (B) includes student, year, and grade fixed effects.
Note. Event-study estimates of ethnic studies enrollment (Equation 1) based on a balanced panel of students who attended the San Francisco Unified School District for at least 2 years.
Figure A6. Effects of ethnic studies enrollment on grade-point average using inverse-propensity-score weights.
Note. Event-study estimates of ethnic studies enrollment using inverse-propensity-score weights based on a balanced panel of students who attended the San Francisco Unified School District for at least 2 years.

References

Abadie A. (2005). Semiparametric difference-in-differences estimators. The Review of Economic Studies, 72, 1–19. https://doi.org/10.1111/0034-6527.00321.
Allensworth E. M., Clark K. (2020). High school GPAs and ACT scores as predictors of college completion: Examining assumptions about consistency across high schools. Educational Researcher, 49(3), 198–211. https://doi.org/10.3102/0013189X20902110
Al-Ubaydli O., List J. A., Suskind D. (2020). 2017 Klein lecture: The science of using science: Toward an understanding of the threats to scalability. International Economic Review, 61(4), 1387–1409. https://doi.org/10.1111/iere.12476
Arkhangelsky D., Athey S., Hirshberg D. A., Imbens G. W., Wager S. (2021). Synthetic difference-in-differences. American Economic Review, 111(12), 4088–4118. https://doi.org/10.1257/aer.20190159
Barber B. K., Olsen J. A. (2004). Assessing the transitions to middle and high school. Journal of Adolescent Research, 19(1), 3–30. https://doi.org/10.1177/0743558403258113
Bell D. A. (1995). Who’s afraid of critical race theory? University of Illinois Law Review, 1995(4), 893–910.
Benner A. D. (2011). The transition to high school: Current knowledge, future directions. Educational Psychology Review, 23(3), 299–328. https://doi.org/10.1007/s10648-011-9152-0
Benner A. D., Graham S. (2009). The transition to high school as a developmental process among multiethnic urban youth. Child Development, 80(2), 356–376. https://doi.org/10.1111/j.1467-8624.2009.01265.x
Benner A. D., Wang Y., Shen Y., Boyle A. E., Polk R., Cheng Y.-P. (2018). Racial/ethnic discrimination and well-being during adolescence: A meta-analytic review. American Psychologist, 73(7), 855–883. https://doi.org/10.1037/amp0000204
Bernal D. D. (2002). Critical race theory, Latino critical theory, and critical raced-gendered epistemologies: Recognizing students of color as holders and creators of knowledge. Qualitative Inquiry, 8(1), 105–126. https://doi.org/10.1177/107780040200800107
Bleiberg J., Brunner E., Harbatkin E., Kraft M. A., Springer M. (2024). Taking teacher evaluation to scale: The effect of state reforms on achievement and attainment (EdWorkingPaper No. 21-496). Annenberg Institute at Brown University. https://doi.org/10.26300/B1AK-R251
Bonilla S., Dee T. S., Penner E. K. (2021). Ethnic studies increases longer-run academic engagement and attainment. Proceedings of the National Academy of Sciences, U S A, 118(37), e2026386118. https://doi.org/10.1073/pnas.2026386118
Bowden A. B., Rodriguez V., Weingarten Z. (2023). The unintended consequences of academic leniency (EdWorkingPaper No. 23-836). Annenberg Institute for School Reform at Brown University. https://eric.ed.gov/?id=ED639089
Cabrera N. L., Milem J. F., Jaquette O., Marx R. W. (2014). Missing the (student achievement) forest for all the (political) trees: Empiricism and the Mexican American studies controversy in Tucson. American Educational Research Journal, 51(6), 1084–1118. https://doi.org/10.3102/0002831214553705
Callaway B., Sant’Anna P. H. C. (2021). Difference-in-differences with multiple time periods. Journal of Econometrics, 225(2), 200–230. https://doi.org/10.1016/j.jeconom.2020.12.001
Candelaria C. A., Crutchfield A. N., McGill D. G. (2024). The impact of additional funding on student outcomes: Evidence from an urban district using weighted student funding and site-based budgeting (EdWorkingPaper No. 24-1006). Annenberg Institute for School Reform at Brown University. https://doi.org/10.26300/kbq5-0b25
Clarke D., Pailañir D., Athey S., Imbens G. (2024). On synthetic difference-in-differences and related estimation methods in Stata. The Stata Journal: Promoting Communications on Statistics and Stata, 24(4), 557–598. https://doi.org/10.1177/1536867X241297914
Coburn C. E. (2003). Rethinking scale: Moving beyond numbers to deep and lasting change. Educational Researcher, 32(6), 3–12. https://doi.org/10.3102/0013189X032006003
Cohen G. L., Garcia J., Apfel N., Master A. (2006). Reducing the racial achievement gap: A social-psychological intervention. Science, 313(5791), 1307–1310. https://doi.org/10.1126/science.1128317
Coleman J. S. (1966). Equality of educational opportunity. ICPSR. https://doi.org/10.3886/ICPSR06389.v3
Cuauhtin R. T. (2019). The ethnic studies framework: A holistic overview. In Cuauhtin R.T., Zavala M., Sleeter C., Au W. (Eds.), Rethinking ethnic studies (pp. 65–75). Rethinking Schools.
Cullen J. B., Levitt S. D., Robertson E., Sadoff S. (2013). What can be done to improve struggling high schools? Journal of Economic Perspectives, 27(2), 133–152.
de los Ríos C. V. (2013). A curriculum of the borderlands: High school Chicana/o-Latina/o studies as Sitios y Lengua. The Urban Review, 45(1), 58–73. https://doi.org/10.1007/s11256-012-0224-3
Dee T. S., Jacob B. (2011). The impact of no Child Left Behind on student achievement. Journal of Policy Analysis and Management, 30(3), 418–446. https://doi.org/10.1002/pam.20586
Dee T. S., Penner E. K. (2017). The causal effects of cultural relevance: Evidence from an ethnic studies curriculum. American Educational Research Journal, 54(1), 127–166. https://doi.org/10.3102/0002831216677002
Delgado R., Stefancic J. (2001). Critical race theory: An introduction. New York University Press.
Diemer M. A., Li C.-H. (2011). Critical consciousness development and political participation among marginalized youth. Child Development, 82(6), 1815–1833. https://doi.org/10.1111/j.1467-8624.2011.01650.x
Diemer M. A., Rapa L. J., Voight A. M., McWhirter E. H. (2016). Critical consciousness: A developmental approach to addressing marginalization and oppression. Child Development Perspectives, 10(4), 216–221. https://doi.org/10.1111/cdep.12193
Domina T., McEachin A., Penner A., Penner E. (2015). Aiming high and falling short: California's eighth-grade algebra-for-all effort. Educational Evaluation and Policy Analysis, 37(3), 275–295. https://doi.org/10.3102/0162373714543685
Eccles J. S., Roeser R. W. (2011). Schools as developmental contexts during adolescence. Journal of Research on Adolescence, 21(1), 225–241. https://doi.org/10.1111/j.1532-7795.2010.00725.x
Eccles J. S., Wong C. A., Peck S. C. (2006). Ethnicity as a social context for the development of African-American adolescents. Journal of School Psychology, 44(5), 407–426. https://doi.org/10.1016/j.jsp.2006.04.001
Erikson E. H. (1968). Identity: Youth and crisis. W.W. Norton.
Elmore R. F. (2016). “Getting to scale . . .”: It seemed like a good idea at the time. Journal of Educational Change, 17(4), 529–537. https://doi.org/10.1007/s10833-016-9290-8
Freire P. (2014). Pedagogy of the oppressed: 30th anniversary edition (M. B. Ramos, Trans.; 30th anniversary ed.). Bloomsbury.
Gay G. (2010). Culturally responsive teaching (2nd ed.; Multicultural Education Series). Teachers College Press.
Gershenson S., Hart C. M. D., Hyman J., Lindsay C. A., Papageorge N. W. (2022). The long-run impacts of same-race teachers. American Economic Journal: Economic Policy, 14(4), 300–342. https://doi.org/10.1257/pol.20190573
Gillespie S., Morency M. M., Chan E., Ferguson G. M. (2024). Psychological and academic adaptation through universal ethnic studies classes: Results of a natural experiment. Journal of Youth and Adolescence, 53(11), 2572–2588. https://doi.org/10.1007/s10964-024-02039-x
Gillespie S., Morency M. M., Fajemirokun E., Ferguson G. M. (2025). Promoting identity development, multicultural attitudes, and civic engagement through ethnic studies: Evidence from a natural experiment. Child Development, 96(3), 966–979. https://doi.org/10.1111/cdev.14219
Goldhaber D., Goodman Young M. (2024). Course grades as a signal of student achievement: Evidence of grade inflation before and after COVID-19. Journal of Policy Analysis and Management, 43, 1270–1282. https://doi.org/10.1002/pam.22618
Glasford D. E., Johnston B. (2018). Respect the technique: Status-based respect increases minority group social cohesion with majority groups, while also increasing minority collective action tendencies. The Journal of Social Psychology, 158(2), 201–214. https://doi.org/10.1080/00224545.2017.1324395
Halagao P. E. (2012). Holding up the mirror: The complexity of seeing your ethnic self in history. Theory & Research in Social Education, 32(4), 459–483. https://doi.org/10.1080/00933104.2004.10473265
Harris D. N., Liu L., Barrett N., Li R. (2023). Is the rise in high school graduation rates real? High-stakes school accountability and strategic behavior. Labour Economics, 82, 102355. https://doi.org/10.1016/j.labeco.2023.102355
Heberle A. E., Rapa L. J., Farago F. (2020). Critical consciousness in children and adolescents: A systematic review, critical assessment, and recommendations for future research. Psychological Bulletin, 146(6), 525–551. https://doi.org/10.1037/bul0000230
Heckman J. J., Ichimura H., Todd P. E. (1997). Matching as an econometric evaluation estimator: Evidence from evaluating a job training programme. The Review of Economic Studies, 64(4), 605–654. https://doi.org/10.2307/2971733
Heckman J. J., Ichimura H., Todd P. (1998). Matching as an econometric evaluation estimator. Review of Economic Studies, 65(2), 261–294. https://doi.org/10.1111/1467-937x.00044
Heckman J. J., Kautz T. (2012). Hard evidence on soft skills. Labour Economics, 19(4), 451–464. https://doi.org/10.1016/j.labeco.2012.05.014
Hu-DeHart E. (1993). The history, development, and future of ethnic studies. The Phi Delta Kappan, 75(1), 50–54.
Hughes J. M., Bigler R. S., Levy S. R. (2007). Consequences of learning about historical racism among European American and African American children. Child Development, 78(6), 1689–1705. https://doi.org/10.1111/j.1467-8624.2007.01096.x
Jepsen C., Rivkin S. (2009). Class size reduction and student achievement: The potential tradeoff between teacher quality and class size. Journal of Human Resources, 44(1), 223–250. https://doi.org/10.1353/jhr.2009.0008
Jones C. (2025, September 18). Ethnic studies was supposed to start in California schools. What happened?CalMatters. https://calmatters.org/education/k-12-education/2025/09/ethnic-studies-california/
Kocivar C. (2024). The battle over ethnic studies. ED100. https://ed100.org/blog/ethnic-studies-conflict
Koretz D., Yu C., Mbekeani P. P., Langi M., Dhaliwal T., Braslow D. (2016). Predicting freshman grade point average from college admissions test scores and state high school test scores. AERA Open, 2(4), 2332858416670601. https://doi.org/10.1177/2332858416670601
Kraft M. A. (2020). Interpreting effect sizes of education interventions. Educational Researcher, 49(4), 241–253. https://doi.org/10.3102/0013189X20912798
Kraft M. A., Schueler B. E., Falken G. (2024). What impacts should we expect from tutoring at scale? Exploring meta-analytic generalizability. (EdWorkingPaper: 24-1031). Annenberg Institute at Brown University. https://doi.org/10.26300/zygj-m525
Kwon S. (2021). Ethnic studies legislation: State scan. Region 15 Comprehensive Center Network, Region 15. https://eric.ed.gov/?id=ED612757
Ladd H. F. (2017). No child left behind: A deeply flawed federal policy. Journal of Policy Analysis and Management, 36(2), 461–469. https://doi.org/10.1002/pam.21978
Ladson-Billings G. (1995). Toward a theory of culturally relevant pedagogy. American Educational Research Journal, 32(3), 465–491. https://doi.org/10.3102/00028312032003465
Ladson-Billings G. (1994). What we can learn from multicultural education research. Educational Leadership, 51(8), 22–26. https://eric.ed.gov/?id=EJ508261
Ladson-Billings G., Tate W. F. (1995). Toward a critical race theory of education. Teachers College Record, 97(1), 47–68. https://doi.org/10.1177/016146819509700104
Lee V. E., Smith J. (2001). Restructuring high schools for equity and excellence: What works. Teachers College Press.
Lewis K. M., Andrews E., Gaska K., Sullivan C., Bybee D., Ellick K. L. (2012). Experimentally evaluating the impact of a school-based African-centered emancipatory intervention on the ethnic identity of African American adolescents. Journal of Black Psychology, 38(3), 259–289. https://doi.org/10.1177/0095798411416458
Lewis K. M., Sullivan C. M., Bybee D. (2006). An experimental evaluation of a school-based emancipatory intervention to promote African American well-being and youth leadership. Journal of Black Psychology, 32(1), 3–28. https://doi.org/10.1177/0095798405283229
List J., Suskind D., Supplee L. (2021). The scale-up effect in early childhood and public policy: Why interventions lose impact at scale and what we can do about it. Routledge & CRC Press.
Matheny K. T., Thompson M. E., Townley-Flores C., Reardon S. F. (2023). Uneven progress: Recent trends in academic performance among U.S. school districts. American Educational Research Journal, 60(3), 447–485. https://doi.org/10.3102/00028312221134769
Medina M. I. (2017). Silencing talk about race: Why Arizona's prohibition of ethnic studies violates equality. Hastings Constitutional Law Quarterly, 45(1), 47–96. Loyola University New Orleans College of Law Research Paper No. 2017-10. https://papers.ssrn.com/sol3/papers.cfm?abstract_id=3060573
Meyer K. E., Bird K. A., Castleman B. L. (2022). Stacking the deck for employment success: Labor market returns to stackable credentials. Journal of Human Resources, 60(1), 129–152. https://doi.org/10.3368/jhr.1120-11320R2
Neal L. V. I., Militz-Frielink S., Colompos-Tohtsonie M. T., Lewis R. A., Moore A. L. (Eds.). (2023). Legacy of action: How Dr. Geneva Gay transformed teaching. Loyola College/Apprentice House.
Nelsen M. D. (2021). Cultivating youth engagement: Race & the behavioral effects of critical pedagogy. Political Behavior, 43(2), 751–784. https://doi.org/10.1007/s11109-019-09573-6
Northern A. M. N., Michael J., Petrilli M. (2018, September 21). How to reverse grade inflation and help students reach their potential. Education Next. https://www.educationnext.org/reverse-grade-inflation-help-students-reach-potential/
Paris D., Alim H. S. (2017). Culturally sustaining pedagogies: Teaching and learning for justice in a changing world. Teachers College Press.
Pattison E., Grodsky E., Muller C. (2013). Is the sky falling? Grade inflation and the signaling power of grades. Educational Researcher, 42(5), 259–265. https://doi.org/10.3102/0013189X13481382
Penner E. K., Ma D. (2024). Access to ethnic studies in California public schools (EdWorkingPapers No. 23-886). Annenberg Institute at Brown University. https://edworkingpapers.com/index.php/ai23-886
Penner E. K., Lopes J., Liu A. G., Quach C., Chang A. (2025). “Learning to liberate”: Teacher practice and praxis during the rollout of district wide ethnic studies courses (Working Paper). Center for Administrative Data Analysis. UC Irvine.
Peurach D. J., Glazer J. L. (2012). Reconsidering replication: New perspectives on large-scale school improvement. Journal of Educational Change, 13(2), 155–190. https://doi.org/10.1007/s10833-011-9177-7
Pharris-Ciurej N., Hirschman C., Willhoft J. (2012). The 9th grade shock and the high school dropout crisis. Social Science Research, 41(3), 709–730. https://doi.org/10.1016/j.ssresearch.2011.11.014
Phinney J., Kohatsu E. (1999). Health risks and developmental transitions during adolescence. Cambridge University Press.
Pinedo A., Diemer M. A., Frisby M. B. (2024). Critical consciousness and youth political activism. Annual Review of Developmental Psychology, 6, 351–372. https://doi.org/10.1146/annurev-devpsych-010923-113449
Pinedo A., Kubi G., Espinoza A. J., Gonzalez J., Diemer M. A. (2025). Ethnic studies and student development: Cultivating racially marginalized adolescents’ critical consciousness. Developmental Psychology, 61(1), 113–133. https://doi.org/10.1037/dev0001850
Polikoff M. (2021). Beyond standards: The fragmentation of education governance and the promise of curriculum reform. Harvard Education Press.
Reyes-McGovern E., Buenavista T. L. (2016). Ethnic studies with K–12 students, families, and communities: The role of teacher education in preparing educators to serve the people. Xchange. https://www.scribd.com/document/561735924/Reyes-McGovern-Buenavista-Ethnic-Studies-with-K-12-Students-Families-and-Communities-The-Role-of-Teacher-Education-in-Preparing-Educators-to-Serve
Rice J. K. (2001). Explaining the negative impact of the transition from middle to high school on student performance in mathematics and science. Educational Administration Quarterly, 37(3), 372–400. https://doi.org/10.1177/00131610121969352
Rivas-Drake D., Markstrom C., Syed M., Lee R. M., Umaña-Taylor A. J., Yip T., Seaton E. K., Quintana S., Schwartz S. J., French S. (2014). Ethnic and racial identity in adolescence: Implications for psychosocial, academic, and health outcomes. Child Development, 85(1), 40–57. https://doi.org/10.1111/cdev.12200
Roth J., Sant’Anna P. H. C., Bilinski A., Poe J. (2023). What’s trending in difference-in-differences? A synthesis of the recent econometrics literature. Journal of Econometrics, 235(2), 2218–2244. https://doi.org/10.1016/j.jeconom.2023.03.008
Sanchez E. I., Moore R. (2022). Grade inflation continues to grow in the past decade [Research report]. ACT. https://eric.ed.gov/?id=ED621326
Schwartz A. E., Hopkins B. G., Stiefel L. (2021). The effects of special education on the academic performance of students with learning disabilities. Journal of Policy Analysis and Management, 40(2), 480–520. https://doi.org/10.1002/pam.22282
Seider S., Graves D. (2020). Schooling for critical consciousness: Engaging Black and Latinx youth in analyzing, navigating, and challenging racial injustice. Harvard Education Press.
Seidman E., Lawrence Aber J., Allen L., French S. E. (1996). The impact of the transition to high school on the self-system and perceived social context of poor urban youth. American Journal of Community Psychology, 24(4), 489–515. https://doi.org/10.1007/bf02506794
Sleeter C. E. (2011). The academic and social value of ethnic studies: A research review. National Education Association Research Department. https://eric.ed.gov/?id=ED521869
Sleeter C. E., Zavala M. (2020). Transformative ethnic studies in schools: Curriculum, pedagogy, and research. Teachers College Press.
Solórzano D. G., Yosso T. J. (2002). Critical race methodology: Counter-storytelling as an analytical framework for education research. Qualitative Inquiry, 8(1), 23–44. https://doi.org/10.1177/107780040200800103
Thomas O., Davidson W., McAdoo H. (2008). An evaluation study of the young empowered sisters (YES!) program: Promoting cultural assets among African American adolescent girls through a culturally relevant school-based intervention. Journal of Black Psychology, 34(3), 281–308. https://doi.org/10.1177/0095798408314136
Tintiangco-Cubales A., Daus-Magbual R., Daus-Magbual A. (2010). Pin@y educational partnerships: A counter-Pipeline to create critical educators. AAPI Nexus: Policy, Practice and Community, 8(1), 76–100. https://doi.org/10.36650/nexus8.1_76-100_TintiangcoCubalesEtAl
Tintiangco-Cubales A., Kohli R., Sacramento J., Henning N., Agarwal-Rangnath R., Sleeter C. (2015). Toward an ethnic studies pedagogy: Implications for K–12 schools from the research. The Urban Review, 47(1), 104–125. https://doi.org/10.1007/s11256-014-0280-y
Umaña-Taylor A. J. (2023). Promoting adolescent adjustment by intervening in ethnic-racial identity development: Opportunities for developmental prevention science and considerations for a global theory of change. International Journal of Behavioral Development, 47(4), 352–365. https://doi.org/10.1177/01650254231162614
Umaña-Taylor A. J., Quintana S. M., Lee R. M., Cross W. E. Jr., Rivas-Drake D., Schwartz S. J., Syed M., Yip T., Seaton E., & Ethnic and Racial Identity in the 21st Century Study Group. (2014). Ethnic and racial identity during adolescence and into young adulthood: An integrated conceptualization. Child Development, 85(1), 21–39. https://doi.org/10.1111/cdev.12196
Vasquez J. M. (2005). Ethnic identity and Chicano literature: How ethnicity affects reading and reading affects ethnic consciousness. Ethnic and Racial Studies, 28(5), 903–924. https://doi.org/10.1080/01419870500158927
von Hippel P., Wagner C. (2018). Does a successful randomized experiment lead to successful policy? Project challenge and what happened in tennessee after project STAR (SSRN. 3153503). https://doi.org/10.2139/ssrn.3153503
Walton G. M., Cohen G. L. (2011). A brief social-belonging intervention improves academic and health outcomes of minority students. Science, 331(6023), 1447–1451. https://doi.org/10.1126/science.1198364
Weiss C. C., Bearman P. S. (2007). Fresh starts: Reinvestigating the effects of the transition to high school on student outcomes. American Journal of Education, 113(3), 395–421. https://doi.org/10.1086/512738
Wiggan G., Watson-Vandiver M. J. (2019). Pedagogy of empowerment: Student perspectives on critical multicultural education at a high-performing African American school. Race Ethnicity and Education, 22(6), 767–787. https://doi.org/10.1080/13613324.2017
Wiggan G., Pass M. B., Gadd S. R. (2023). Critical race structuralism: The role of science education in teaching social justice issues in urban education and pre-service teacher education programs. Urban Education, 58(9), 2209–2238. https://doi.org/10.1177/0042085920937756
Xu D., Trimble M. (2016). What about certificates? Evidence on the labor market returns to nondegree community college awards in two states. Educational Evaluation and Policy Analysis, 38(2), 272–292. https://doi.org/10.3102/0162373715617827
Yeager D. S., Hanselman P., Walton G. M., Murray J. S., Crosnoe R., Muller C., Tipton E., Schneider B., Hulleman C. S., Hinojosa C. P., Paunesku D., Romero C., Flint K., Roberts A., Trott J., Iachan R., Buontempo J., Yang S. M., Carvalho C. M.,. . .Dweck C. S. (2019). A national experiment reveals where a growth mindset improves achievement. Nature, 573(7774), 364–369. https://doi.org/10.1038/s41586-019-1466-y
Yosso T. J. (2005). Whose culture has capital? A critical race theory discussion of community cultural wealth. Race Ethnicity and Education, 8(1), 69–91. https://doi.org/10.1080/1361332052000341006

Biographies

Biraj Bisht is a doctoral student in the School of Education at the University of California, Irvine. His research examines how educational policy shapes learning, engagement, and opportunity in K–12 systems, with a focus on disparities experienced by students of color and those from low socioeconomic backgrounds.
Sade Bonilla is an assistant professor of education policy at the University of Pennsylvania Graduate School of Education. Her research examines how education policies and institutional practices shape student access, engagement, and academic outcomes across K–12 and postsecondary contexts, with particular attention to equity implications for students from low-income backgrounds and racially minoritized groups.
Grace (Ha Eun) Kim is a research analyst at the Center for the Transformation of Schools at the University of California, Los Angeles, where she supports various teams, including, but not limited to, the Educator Diversity team and the Computational Thinking Equity Project. Grace uses quantitative and qualitative research methodologies to address critical education policy questions regarding racial and socioeconomic inequality in school experiences and outcomes.
Emily K. Penner is an associate professor of education policy and social context in the School of Education at the University of California, Irvine. Her research focuses on K–12 education policy and considers the ways that districts, schools, teachers, and families contribute to and ameliorate educational inequality.