1. Introduction
The Newcomb-Benford Law (NBL), also known as Benford’s Law or the First-Digit Law, is a statistical phenomenon that characterizes the expected distribution of leading digits in a wide range of real-world datasets (Benford, 1938; Newcomb, 1881). According to the Newcomb-Benford Law (NBL), the digit 1 appears as the leading digit about 30% of the time, followed by the digit 2 at roughly 18%, with the frequency gradually decreasing for higher digits. A rigorous mathematical proof of the law was developed by Hill (1995).
NBL is widely applied as a forensic tool for detecting suspicious patterns in data (Nigrini, 2012). Scholars have applied this law in various fields, including international trade (Cerioli et al., 2019), money laundering (Deleanu, 2017), elections (Figueiredo Filho et al., 2022; Mebane, 2006; Pericchi & Torres, 2011) and campaign finance (Cho & Gaines, 2007; Gamermann & Antunes, 2018). Researchers have also applied the Newcomb-Benford Law to analyze data related to the COVID-19 pandemic (Campolieti, 2021; Farhadi, 2021; Lee et al., 2020; Silva & Figueiredo Filho, 2020). These studies primarily evaluate how well the digit frequencies in epidemiological figures align with the NBL. Deviations from theoretical distribution are interpreted as potential signals of inconsistencies, encompassing deliberate fraud or failures in surveillance systems to provide reliable information (Balashov et al., 2021; Figueiredo Filho et al., 2022; Kennedy & Yam, 2020).
In this paper, we follow the framework developed by Figueiredo et al. (2022) to challenge the conclusions reported by Koch and Okamura (2020) regarding the distribution of Chinese COVID-19 figures. The reasoning for reanalyzing Koch and Okamura (2020) data is the lack of rigor in their data analysis. First, they reject the null hypothesis by cherry-picking evidence. Second, they offer an unsolid claim to use Kuiper test instead of the chi-square test. Additionally, we believe that students and professionals will benefit from our replication materials since we provide detailed guidance on how to implement the aforementioned tests using R statistical programming language.
The remainder of the paper is structured as follows: Section 2 offers an account of the data employed in this study and delivers a concise overview of the Newcomb-Benford Law. In Section 3, a series of multiple conformity tests are presented, focusing specifically on the data provided by Koch and Okamura (2020), with the aim of questioning and scrutinizing their primary findings. Finally, Section 4 concludes the paper.
2. Materials and methods
2.1 Data
Following the best scientific practices (Figueiredo Filho et al., 2019), we contacted both authors asking for cleaned data and computational scripts, but as of the submission of this paper they have not replied. Thus, we downloaded the original dataset from the Mendeley website (Koch & Okamura, 2020). However, the display of the information is not standardized across countries and neither computational scripts nor codebooks were provided, which makes it challenging to reproduce their results.
In spite of this difficulty, we identified which columns were used to run Benford Law first digit analysis. Then, we saved the spreadsheets as independent files and after some data cleaning we produced three files in .xlsx format: China, Italy and US. All data is aggregated by country with daily periodicity. We have collected data from February 28, 2020 to July 1, 2020.
2.2 Statistical analysis
Discovered independently by Simon Newcomb in 1881 and later popularized by physicist Frank Benford in 1938, this empirical observation asserts that in naturally occurring numerical datasets, the leading digits of numbers are not uniformly distributed as one might intuitively assume (Benford, 1938; Newcomb, 1881). Instead, smaller digits, particularly ‘1,’ occur more frequently as the first digit than larger ones, such as ‘9.’ The exact distribution for the NBL for the first digit is given by:
This intriguing non-uniform distribution has been found to emerge across several datasets, ranging from financial accounting, population demographics, scientific data, to even naturally occurring phenomena. As a result, the Newcomb-Benford Law has gained significant prominence for its potential applications in fraud detection, data integrity assessment, and as a valuable tool for anomaly detection in large-scale datasets. Table
1 shows the NBL theoretical frequency of the first, second, third, and fourth digits.
For the application of Benford’s Law to a specific dataset, the data should exhibit a geometric progression or consist of multiple geometric progressions (Lee et al., 2020; Nigrini, 2012). Moreover, it requires large data sets whose numbers combine multiple distributions, cover several orders of magnitude, and where the mean is greater than the median with a positive skew (Cho & Gaines, 2007; Ciofalo, 2009; Janvresse, 2004). In the context of COVID-19 data, the exponential rise in SARS-COV-2 infections fulfills these assumptions (Hutzler et al., 2021). MAD estimates should be interpreted following Nigrini’s (2012) guidelines, as reported in Table
2.
2.3 Computational tools
All statistical analyses were performed using R Statistical, version 4.1.2, and all tests were two sided with 5% of significance level Replication materials including raw data and computational scripts are available at:
https://osf.io/ ep3wd/.
3. Results
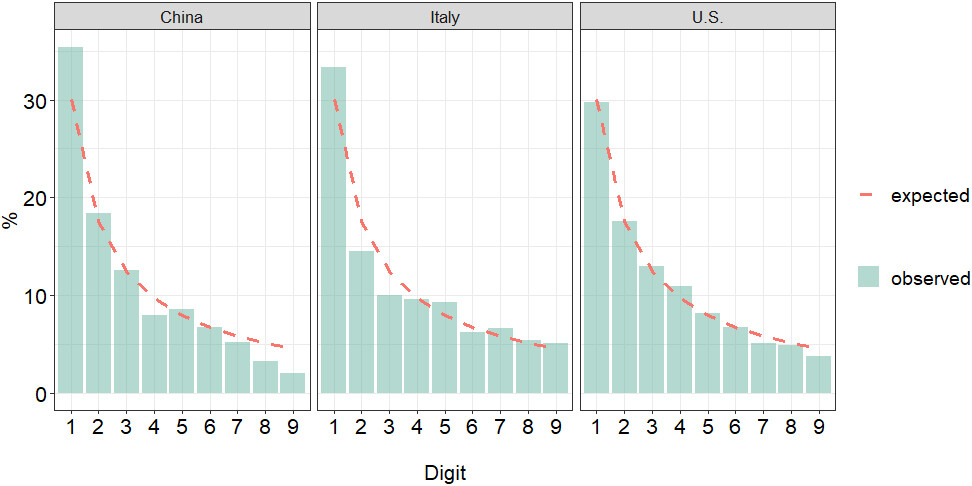
Figure
1 and Table
3 compare the first digit distribution of COVID-19 confirmed cases with the theoretical expectation under Newcomb-Benford Law by country.
Comparatively, the figures from China exhibit the highest deviation from what is expected under the hypothesis of conformity to NBL. Specifically, while the expected theoretical frequency of the first digit is 30.1%, estimates from China indicate an observed frequency of 35%. We also detected a strong underestimation of 8 and 9 digits. In contrast, data from the U.S. and Italy demonstrate a strongest adherence to Benford’s Law. Following Nigrini’s (2012) recommendation, Table
4 shows the reanalysis of Koch and Okamura (2020) data by including multiple conformity tests.
The results indicate that regardless of the measure, the Chinese data fails to conform to the Newcomb-Benford Law. Both Chi-square (China
26.12,
-value 0.001; Italy
18.13,
-value 0.02; US
17.35;
-value 0.027) and Kolmogorov-Smirnov (China
15.51,
-value
0.001; Italy
6.76,
-value
0.001; US
10.26,
-value
0.001) tests are highly significant, leading to the rejection of the null hypothesis. The Mean Absolute Deviation (MAD) values further reinforces this nonconformity (China
0.0154 [Nonconformity]; Italy
0.0137 [Marginally acceptable conformity]; US
0.0044 [Close conformity]), as described in Table
4.
Comparatively, the Chinese data exhibits higher distortion factor (22.42) than Italy (2.27) and the U.S (4.03), indicating a strong underestimation (Nigrini, 2012). Theoretically, adherence to Benford’s Law also implies a uniform distribution of mantissa. According to Newcomb (1881), “the law of probability of the occurrence of numbers is such that all mantissa of their logarithms are equally probable” (Newcomb, 1881, p. 3). While China (0.412) significantly deviates from the expected distribution under Benford’s Law (0.500), Italy (0.481) and the U.S. (0.487) show closer values to the theoretical distribution. In summary, the distribution of COVID-19 confirmed infections in China neither matches the distribution expected under Benford’s Law nor aligns with the figures observed in the U.S. and Italy, as reported by Koch and Okamura (2020). This finding is supported by Peng and Nagata (2020), Kennedy and Yam (2020) and Lee et al. (2020).
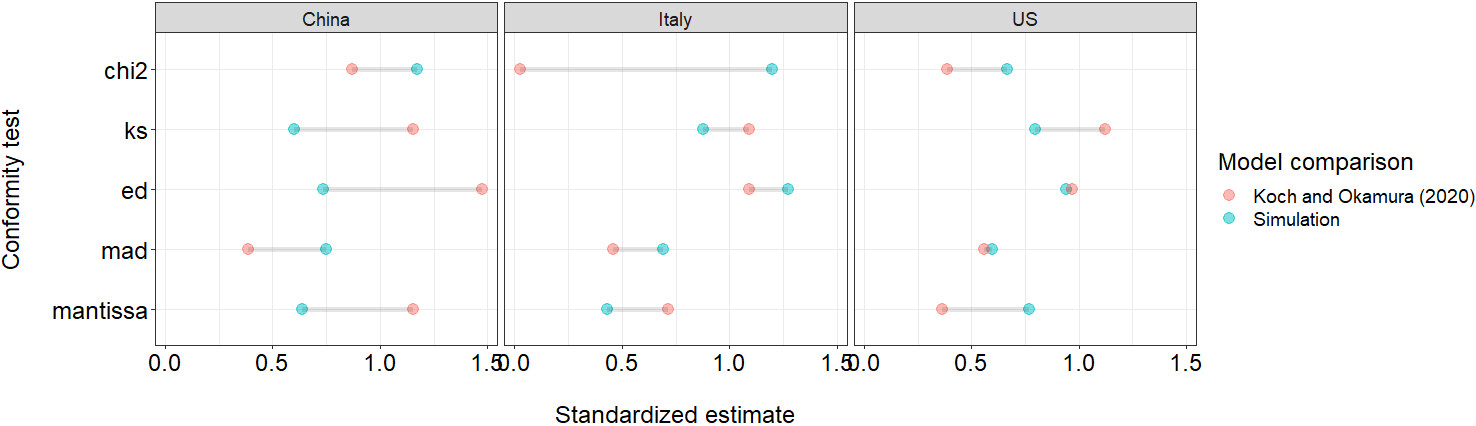
In what follows we show the advantage of using multiple conformity tests to evaluate the results of NBL empirical applications. To do so, we constructed three artificial datasets that match the exact same sample size analyzed by Koch and Okamura (2020). Figure
2 compares the conformity measures from the simulated data, which perfectly fits the Benford-Law expectations, to the goodness-of-fit estimates reported in Koch and Okamura (2020).
Statistical theory teaches us that when sample size increases, statistical tests tend to become more sensitive, increasing the likelihood of detecting smaller effects. Therefore, statistical power plays a key role in scientific inference by determining the probability of correctly rejecting a false null hypothesis. Koch and Okamura (2020) are right when they argue that the Chi-square test is sensitive to sample size. However, they failed to acknowledge that the excess of power “starts being noticeable for data sets with more than 5,000 records” (Nigrini, 2012, p. 154), which is not the case in their study. In essence, Koch and Okamura (2020) specifically selected the Kuiper test, which aligned with their hypothesis. Had they chosen any other test, they could have arrived at the opposite conclusion. It is essential to recognize the potential influence of test selection on the study’s outcomes, In addition, our simulations show that the joint application of multiple conformity tests leads to more reliable conclusions regarding the role of sample size driving empirical results when using NBL.
4. Conclusions
This paper expands upon the work conducted by Koch and Okamura (2020) in their application of Benford’s Law to evaluate the integrity of COVID-19 data. In an effort to enhance our comprehension of NBL, we emphasize the significance of employing multiple conformity tests, which yield more robust inferences compared to relying solely on a single measure. Our results show that Koch and Okamura (2020) findings do not hold under multiple testing. In particular, we demonstrate that the joint application of conformity tests is a more reliable approach to evaluate data integrity in NBL settings. Whether deviations from Benford’s Law are useful for detecting misreported or fraudulent data remains controversial, but approaching this question demands a more thoughtful statistical analysis than what is presented in the Koch and Okamura (2020)’s piece.
Despite the contribution we have made, there are some limitations that are worth mentioning. First, we were unable to access appropriate replication materials from Koch and Okamura’s (2020) study. Consequently, we may have missed some of their methodological procedures. Second, there is widespread skepticism regarding COVID-19 epidemiological data in general, mainly due to reporting delays and measurement errors. Taking these shortcomings into consideration, they could potentially act as sources of bias.
Acknowledgments
We are thankful to the Coordenação de Aperfeiçoamento de Pessoal de Nível Superior (CAPES) and Fundação de Amparo à Pesquisa do Estado de Alagoas (FAPEAL) for their financial support. We also appreciate the referees for their constructive comments which have led to significant improvement of the manuscript.